













公式サプライヤー
公式および認定ディストリビューターとして200社以上の開発元から正規ライセンスを直接ご提供いたします。
当社のすべてのブランドをご覧ください。
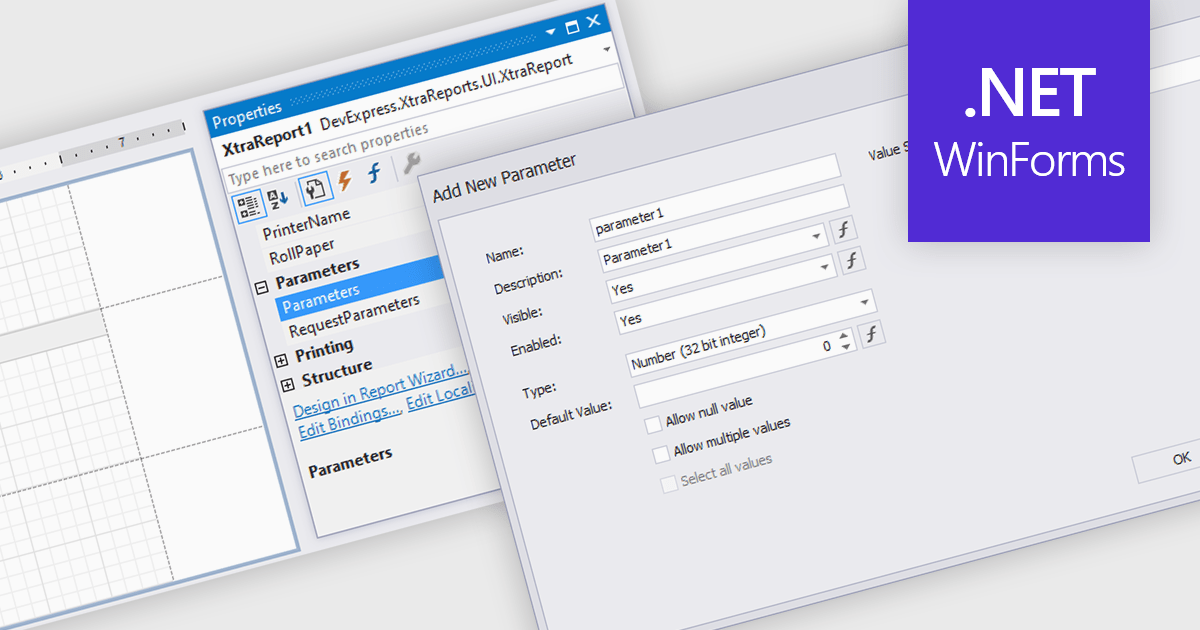
Dialog forms for parameters in reporting provide a structured and user friendly way to collect the inputs needed for accurate, relevant reports. Instead of relying on manual entry or remembered criteria, users are guided through fields that ensure consistent and valid information. This improves report quality and reduces errors in scenarios such as choosing date ranges, product categories, regions, or departments. By centralizing parameter entry in a clean interface, dialog forms let users focus on interpreting results rather than managing input details.
Several .NET WinForms reporting components allow you to create dialog forms for parameters, including:
For an in-depth analysis of features and price, visit our comparison of .NET WinForms reporting components.
ActiveReportsJS by MESCIUS is a JavaScript reporting toolkit that allows developers to design and embed interactive reports within web applications. It includes a standalone report designer for building reports visually and a JavaScript report viewer component that integrates with web frameworks such as React or vanilla JavaScript. The toolkit supports a range of data visualization options and export formats, helping developers deliver rich, interactive reporting capabilities in the browser.
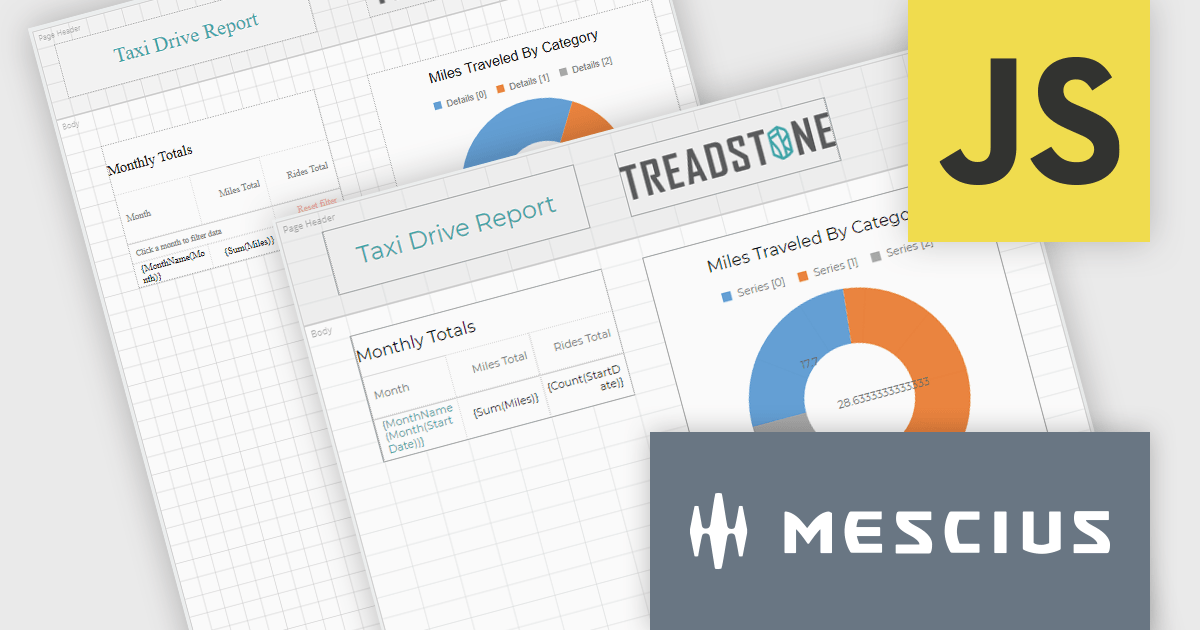
The ActiveReportsJS v6.0 update introduces a new cell-based layout mode that provides precise control over the alignment and structure of report elements using a grid of cells. This layout mirrors the structure of spreadsheets, making it particularly effective for generating reports intended for export to Microsoft Excel. It helps minimize layout inconsistencies and fragmented cells, ensuring a clean and predictable structure for exported files. Developers benefit from a more consistent and data-oriented layout approach, especially in scenarios where structural accuracy is critical.
To see a full list of what's new in 6.0, see our release notes.
ActiveReportsJS is licensed on an annual subscription or perpetual basis and is available as a Single Deployment License for non-commercial use, and as a Single Domain License or Unlimited Domain License for commercial and/or SaaS use. See our ActiveReportsJS licensing page for full details.
Learn more on our ActiveReportsJS product page.
Telerik Reporting is a comprehensive and lightweight embedded reporting tool for .NET web and desktop applications. It enables developers and reporting users to create, design, and export visually appealing, interactive, and reusable reports to effectively present analytical and business data. It supports various technologies, including ASP.NET Core, Blazor, ASP.NET MVC, ASP.NET AJAX, HTML5/JS, Angular, WPF, WinForms, and WinUI.
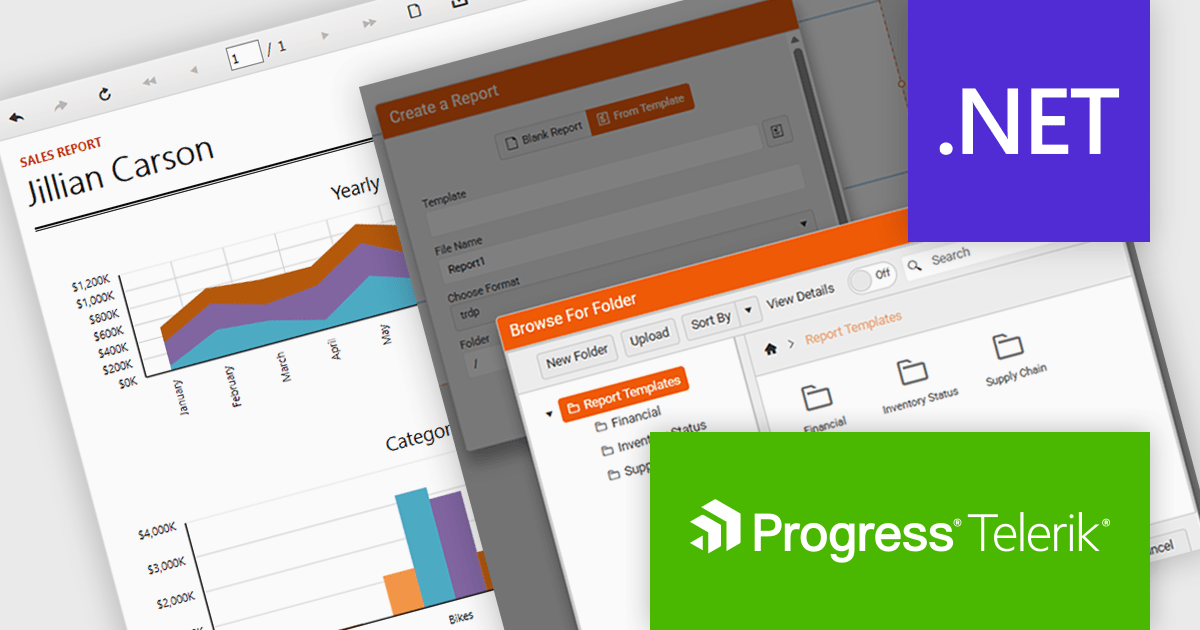
The Telerik Reporting 2025 Q4 update introduces customizable report templates in the Web Report Designer, giving developers a faster and more controlled way to produce consistent, production-ready reports. By allowing teams to define, save and reuse templates that include predefined layout structures, styling rules and data components, the feature reduces repetitive setup work, maintains uniform design standards across projects and ensures every new report begins with a reliable, compliant foundation.
To see a full list of what's new in 2025 Q4 (19.3.25.1111), see our release notes.
Telerik Reporting is licensed per developer and is available as a perpetual license with a one year support subscription, which is offered in three tiers: Lite, Priority or Ultimate. See our Telerik Reporting licensing page for full details.
Telerik Reporting is available to buy in the following products:
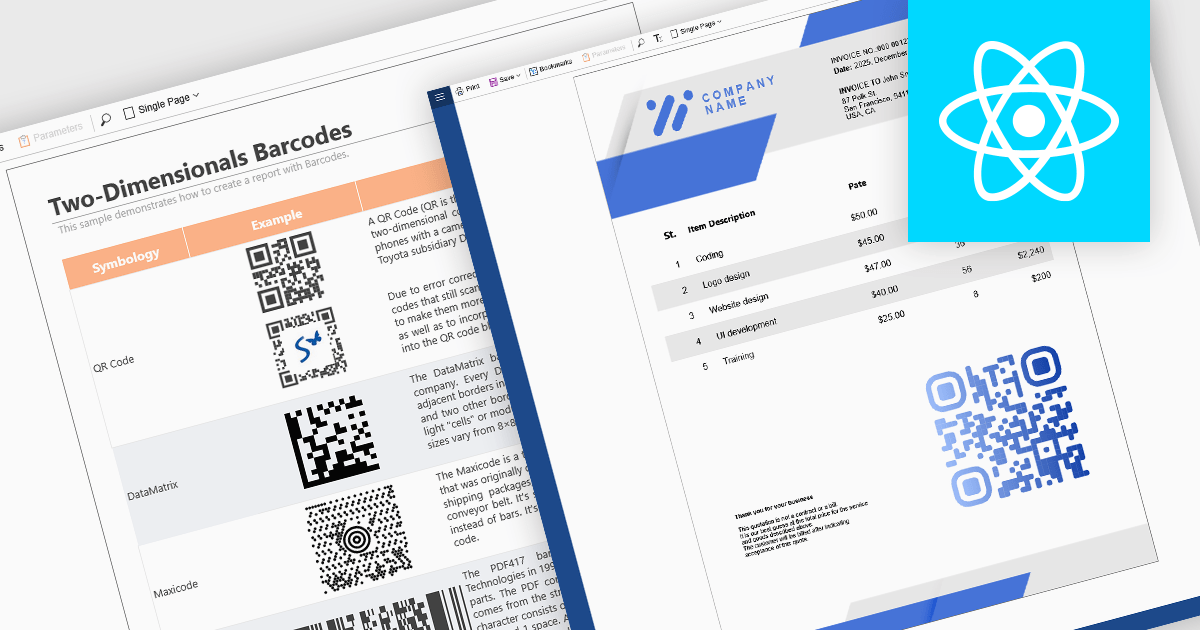
Barcode support in reporting components enables developers to embed machine-readable codes (barcodes, QR codes, DataMatrix, etc.) directly into reports. This feature is especially useful when printed or digital reports need to integrate with scanning systems, for example, in inventory management, shipping labels, product catalogs, or document tracking. By using a barcode component within a report template, reports can dynamically encode data fields (such as item IDs, order numbers, or URLs), ensuring that each generated report contains a barcode that corresponds to its data. This promotes automation, reduces manual errors, and improves interoperability with external scanning or inventory systems.
Several React reporting controls offer barcode support including:
For an in-depth analysis of features and price, visit our React reporting controls comparison.
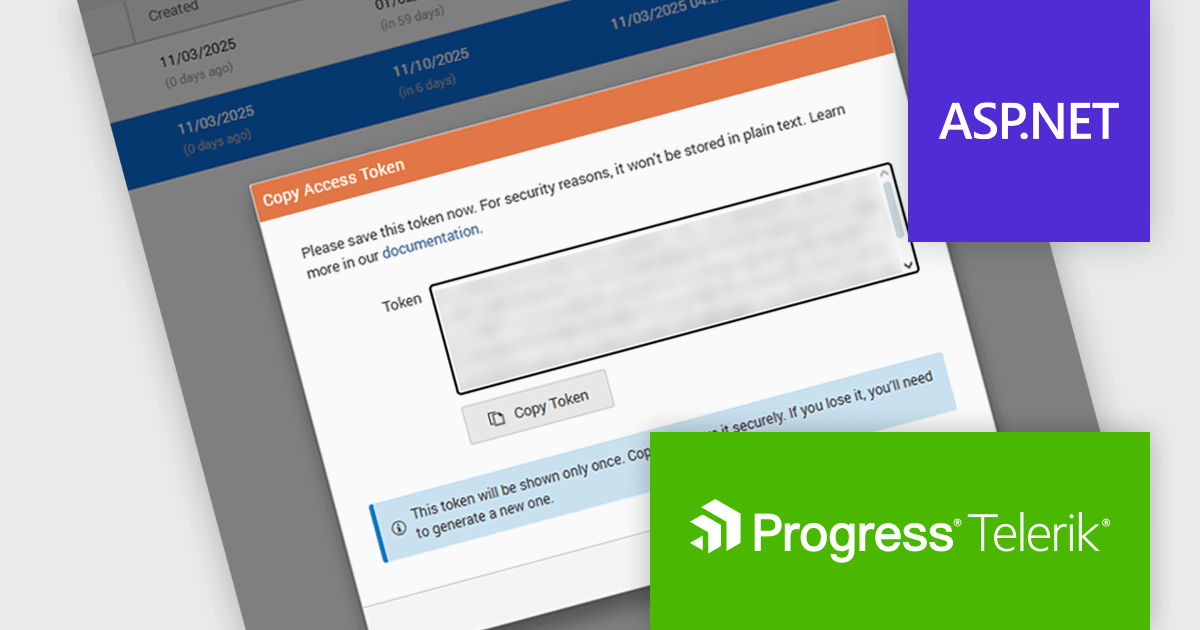
Telerik Report Server is a comprehensive and flexible end-to-end solution for managing reports. Built with the Telerik Reporting library, it is a server-based Windows web application that provides centralized storage, organization, and previewing of reports, along with features for scheduling, delivery, and user management. Report Server can act as a standalone solution or be integrated within an application, allowing developers to create, manage, and distribute reports across multiple platforms including Blazor, Angular and Windows Forms.
The Telerik Report Server 2025 Q4 update introduces Access Token Provisioning directly in the RS.NET UI, giving developers a more efficient and controlled way to authenticate applications and services without relying on external scripts or manual API calls. This enhancement centralizes token management by allowing tokens to be generated, reviewed, and maintained within the interface itself. It also enables developers to create time-bound sharing links backed by temporary user permissions, providing a secure and predictable method for distributing report documents while maintaining clear control over access duration and scope.
To see a full list of what's new in 2025 Q4 (11.3.25.1111), see our release notes.
Telerik Report Server is available as a perpetual or annual license and is licensed per domain. Each domain license contains 15 Client Access Licenses and 1 year support and maintenance. See our Telerik Report Server licensing page for full details.
Telerik Report Server is available individually or as part of Telerik DevCraft Ultimate.
電話: (888) 850 9911
Fax: +1 770 250 6199


