


公式サプライヤー
公式および認定ディストリビューターとして200社以上の開発元から正規ライセンスを直接ご提供いたします。
当社のすべてのブランドをご覧ください。
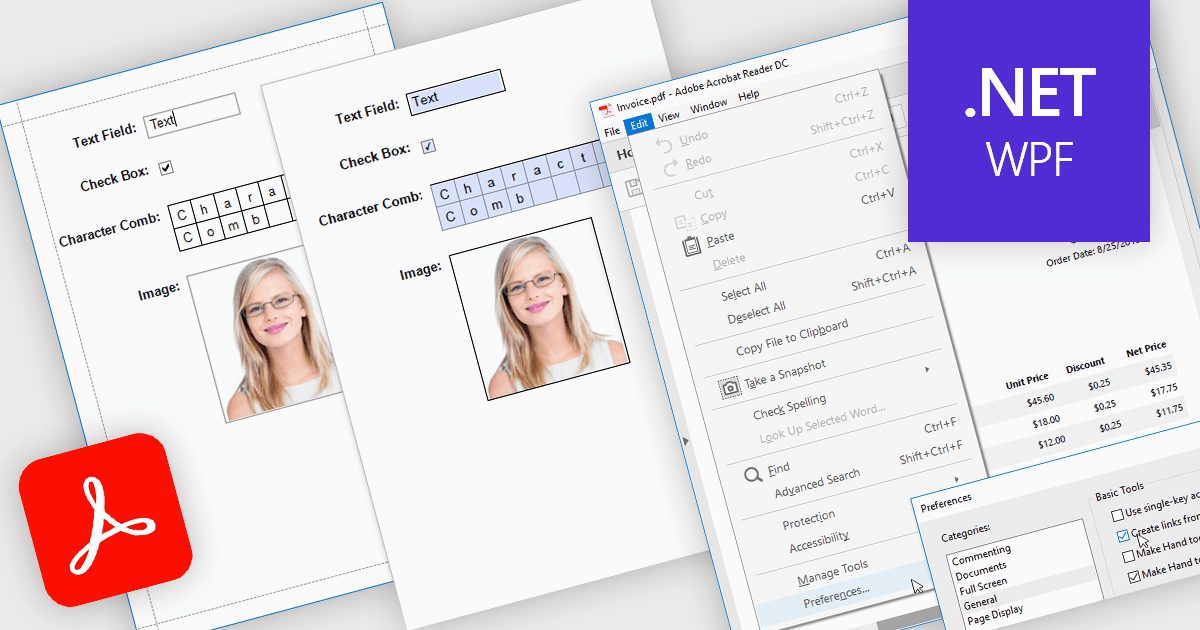
Exporting reports to PDF with AcroForms enables reports to be saved as PDF files containing fully interactive form fields, rather than static text. Editable elements such as text boxes, checkboxes, radio buttons, and drop-down lists remain fillable after export, allowing users to complete forms directly in standard PDF viewers like Adobe Acrobat Reader - without the need for specialized software. The benefits are considerable: organizations can reduce manual data entry, maintain consistent formatting across distributed documents, and improve accessibility for end users. For instance, a company might export an invoice report with editable billing details, create a survey that recipients can fill out digitally, or generate compliance forms that clients can complete and return electronically. By embedding interactive fields directly into exported reports, AcroForms help make document workflows more efficient, accurate, and user-friendly.
Several .NET WPF reporting controls offer Export to PDF with AcroForms including:
For an in-depth analysis of features and price, visit our comparison of .NET WPF reporting controls.
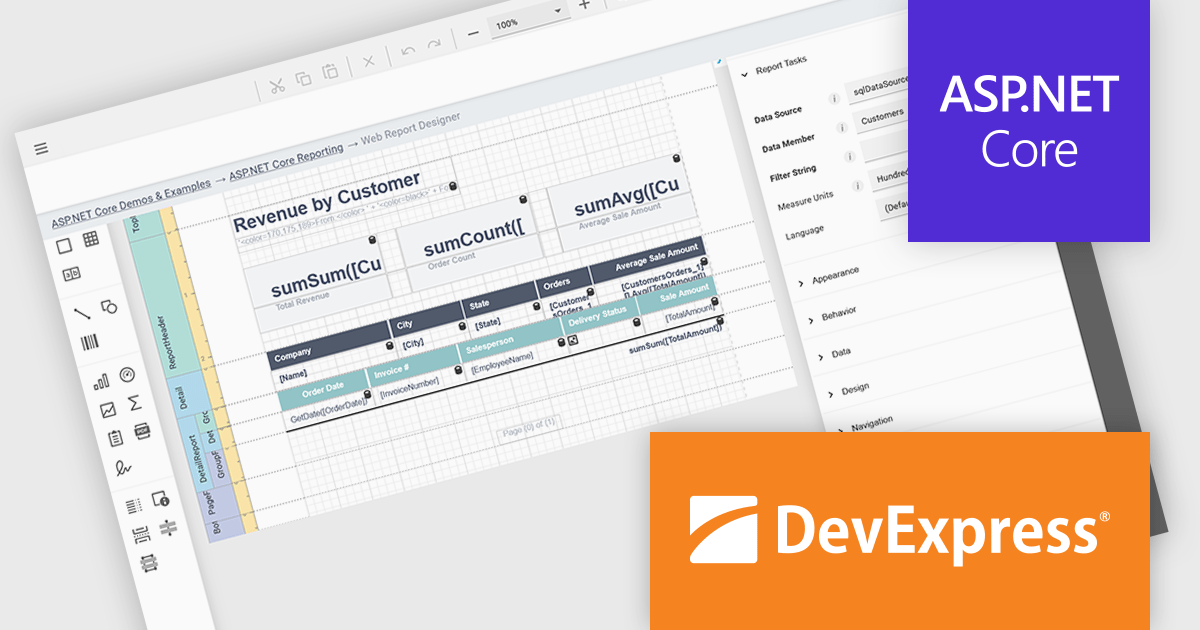
DevExpress ASP.NET Core is a powerful suite of UI components and reporting tools designed to enhance the development of modern, data-driven web applications built with ASP.NET Core. It leverages the flexibility of client-side JavaScript libraries like DevExtreme with the ease of server-side ASP.NET Core Razor syntax and Web APIs. This hybrid approach allows developers to build rich, responsive UIs with features like data grids, editors, schedulers, and charts, while maintaining the productivity and control of server-side development.
DevExpress ASP.NET Core Reporting includes a web-based report designer that lets users build and edit reports directly in their browser. This removes the need for separate desktop tools or installations, making it easier to deploy and manage. The browser-based approach works across platforms and provides a consistent interface for editing layouts, data connections, and formatting. It also allows business users to handle report changes on their own, reducing the amount of hands-on support developers need to provide, while fitting easily into existing ASP.NET applications.
DevExpress ASP.NET and Blazor is licensed per developer and is available as a Perpetual License with a 12 month support and maintenance subscription. See our DevExpress ASP.NET and Blazor licensing page for full details.
DevExpress ASP.NET and Blazor is available to buy in the following products:
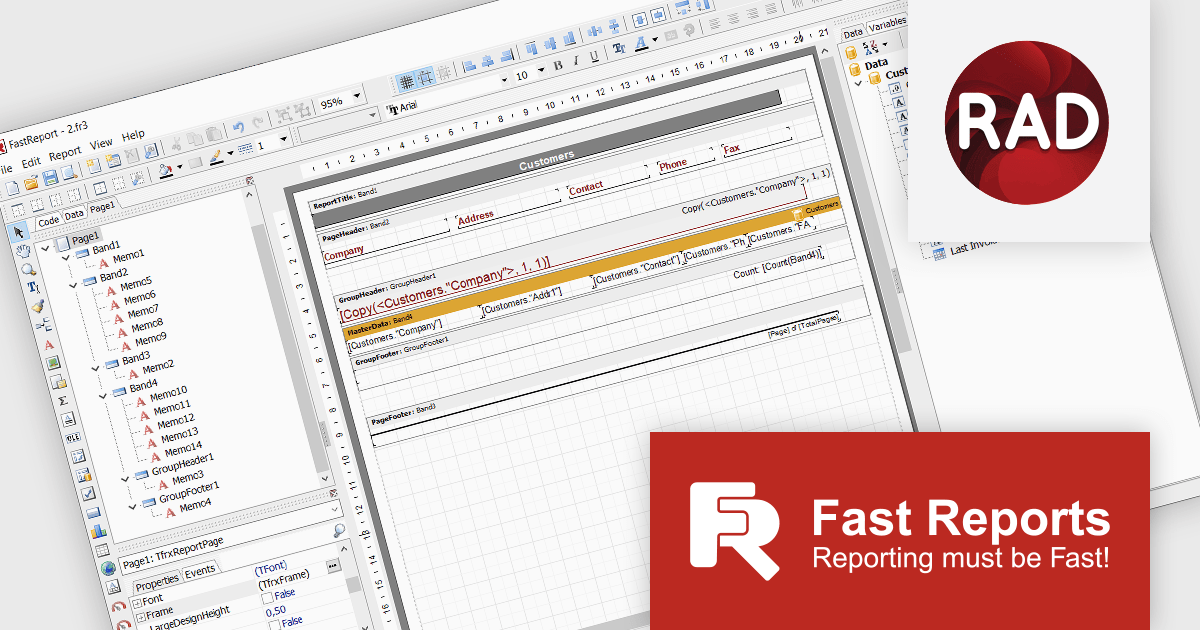
FastReport VCL Ultimate is a comprehensive reporting toolkit designed for Delphi, C++Builder, VCL, FMX (FireMonkey) and cross‑platform business applications. It provides a visual report designer, a rich set of report bands (headers, footers, detail, nested reports, masters/detail, etc.), a powerful scripting engine (PascalScript, C++ Script, BasicScript, JScript), export to many formats (PDF, XLSX, DOCX, HTML, SVG, image formats, etc.), interactive preview/print capabilities, and built‑in client‑server components. It also includes FastCube for multidimensional analysis and advanced filtering, sorting, style inheritance, and cloud storage / transport options for reports.
The FastReport VCL v2025.2.7 release adds support for Embarcadero RAD Studio 13, enabling developers to work confidently with the latest compilers, language updates, and IDE features. By aligning with the new environment, FastReport VCL is designed to preserve design-time integration and runtime behavior, helping reduce migration risk and ongoing maintenance when upgrading existing projects. At the same time, it opens the door to RAD Studio 13’s newest tools, debugging capabilities, and performance improvements, allowing developers to create and deliver reports, scripts, and embedded report designer components on a modern, fully supported platform.
To see a full list of what's new in v2025.2.7, see our release notes.
FastReport VCL Ultimate is licensed per named user and is available as a Perpetual license with 1 year of technical support and product updates. See our FastReport VCL Ultimate licensing page for full details.
Learn more on our FastReport VCL Ultimate product page.
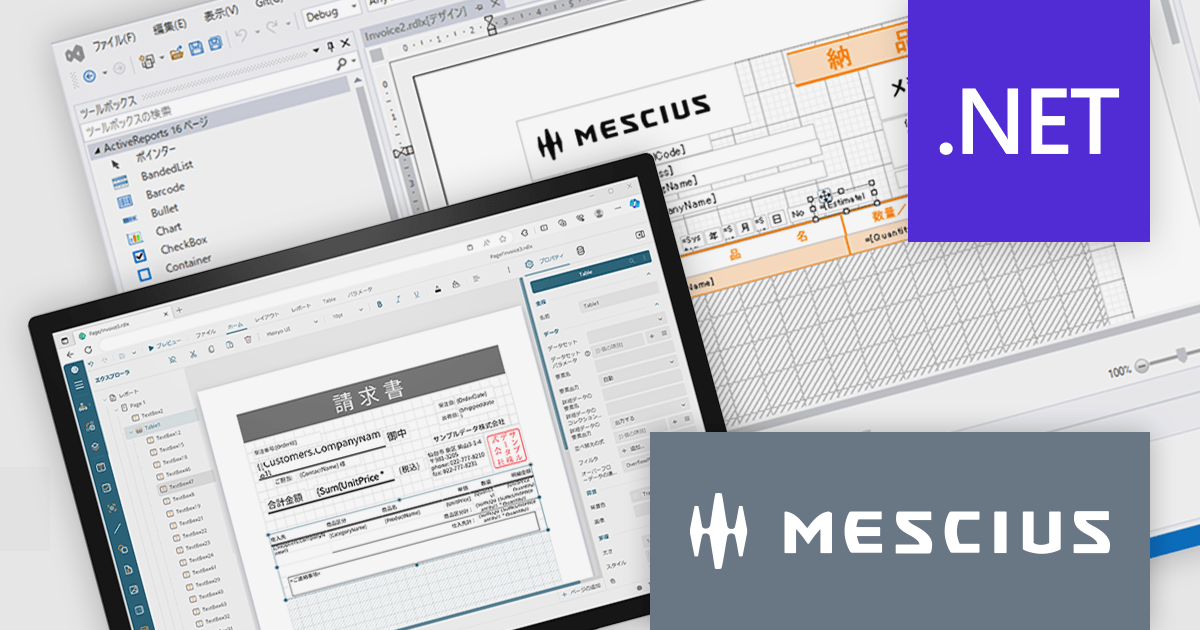
ActiveReportsは、帳票開発を強力に支援する.NET向け帳票ツールです。最新の 18.0J では、使いやすさとパフォーマンスがさらに向上し、直感的なデザイナや豊富な帳票出力形式、最新フレームワークへの対応を実現しています。開発効率を高めながら、高品質な帳票を短時間で作成できます。
2025年10月に予定されている Windows 10のサポート終了 に伴い、今後の業務システムは Windows 11対応 が求められます。ActiveReports for .NET 18.0J は最新環境への最適化が施されており、円滑な移行を実現するためには本バージョンへのアップグレードが必要です。旧バージョンのままでは、Windows 11での安定稼働が保証されませんのでご注意ください。
現在、ActiveReports for .NET 18.0J カムバックキャンペーンを実施中です。ActiveX版を含むすべての旧バージョンのActiveReportsユーザー様が対象として、特別価格でのアップグレードをご提供しております。お得なこの機会にぜひ最新環境へ移行し、今後の開発基盤を安心・安定の最新バージョンでご活用ください。
製品別のキャンペーン詳細およびご購入は、以下のリンクからご確認いただけます。
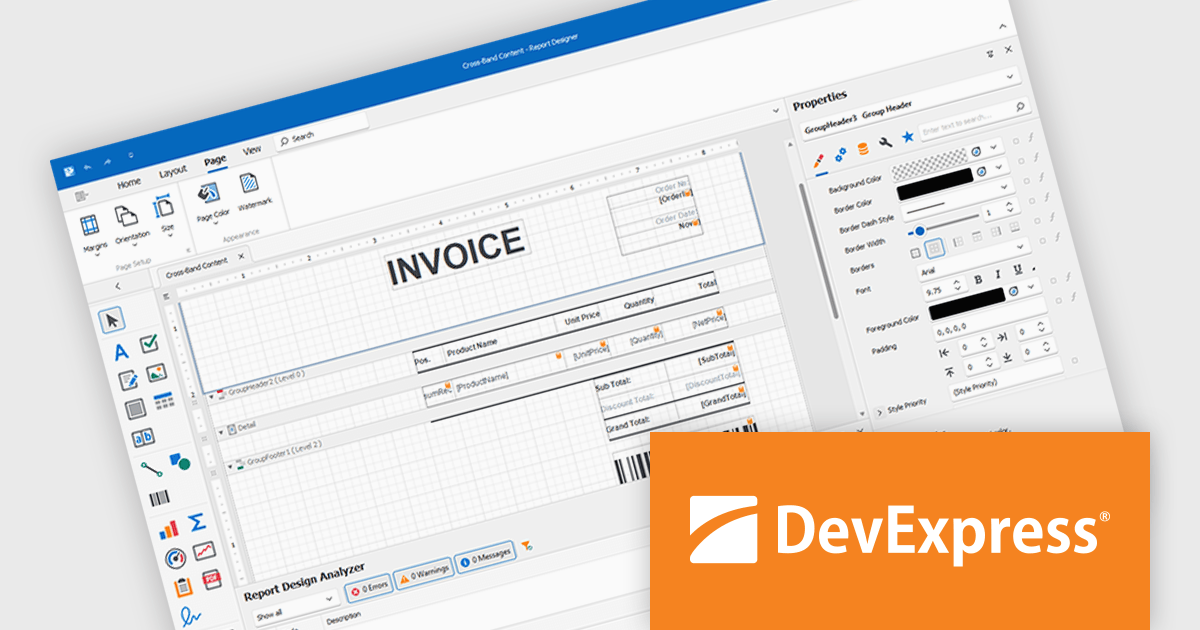
DevExpress Reporting is a comprehensive suite of reporting tools that help developers create visually stunning and highly customizable reports for various applications. With its rich feature set, including data binding, layout design, printing, and exporting capabilities, DevExpress Reporting enables the efficient creation of reports that meet the most demanding business requirements.
DevExpress Reporting lets developers build custom report controls that go beyond the built-in options, making it easier to meet specific project needs. These controls can include unique visual elements or functions that fit naturally into the existing reporting setup, keeping reports consistent in both appearance and behavior. Custom controls also help standardize design, support reusable logic, and handle specialized data presentation that standard controls may not cover, improving maintainability and scalability over time.
DevExpress Reporting is licensed per developer and is available as a Perpetual License with a 12 month support and maintenance subscription. See our DevExpress Reporting licensing page for full details.
DevExpress Reporting is available to buy in the following products:
電話: (888) 850 9911
Fax: +1 770 250 6199


