


公式サプライヤー
公式および認定ディストリビューターとして200社以上の開発元から正規ライセンスを直接ご提供いたします。
当社のすべてのブランドをご覧ください。
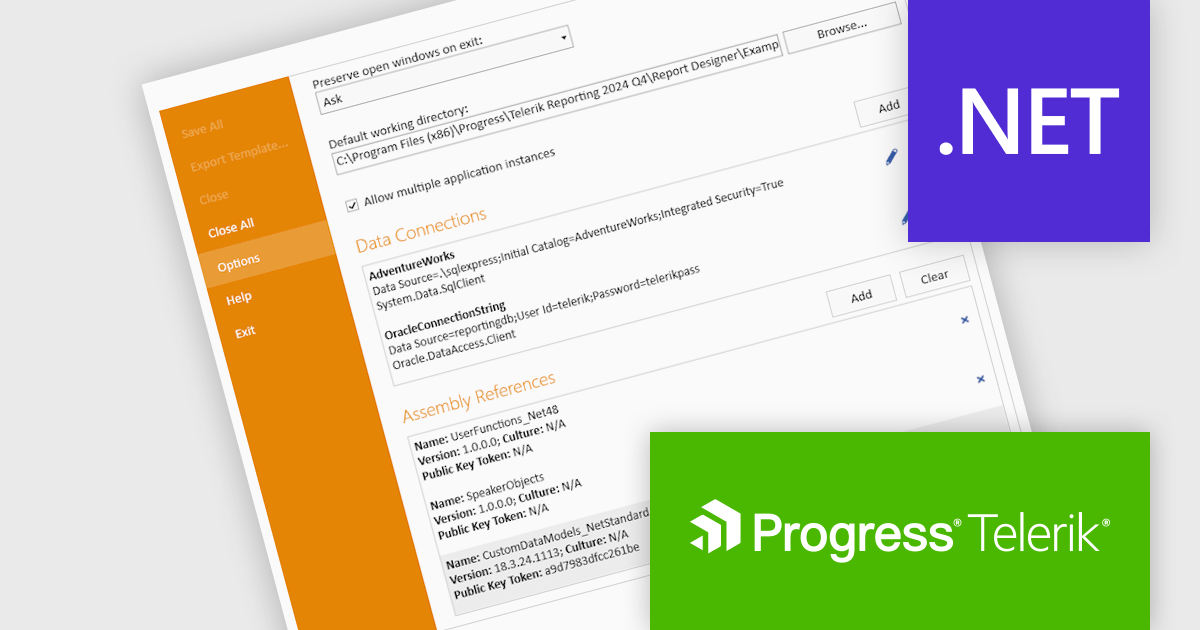
Telerik Reporting is a comprehensive and lightweight embedded reporting tool for .NET web and desktop applications. It enables developers and reporting users to create, design, and export visually appealing, interactive, and reusable reports to effectively present analytical and business data. It supports various technologies, including ASP.NET Core, Blazor, ASP.NET MVC, ASP.NET AJAX, HTML5/JS, Angular, WPF, WinForms, and WinUI.
The Telerik Reporting 2024 Q4 update introduces enhanced Standalone Report Designer tooling, providing developers with a streamlined approach to extending the Standard Report Definition (SRD). This new tooling allows for seamless customization through an intuitive UI, eliminating the need to manually edit configuration files or restart the designer after modifications. By enabling real-time updates and reducing workflow interruptions, this feature enhances development efficiency, minimizes errors, and accelerates iteration cycles, ensuring a more productive and user-friendly reporting experience.
To see a full list of what's new in 2024 Q4 (18.3.24.1112), see our release notes.
Telerik Reporting is licensed per developer and is available as a perpetual license with a one year support subscription, which is offered in three tiers: Lite, Priority or Ultimate. See our Telerik Reporting licensing page for full details.
Telerik Reporting is available to buy in the following products:
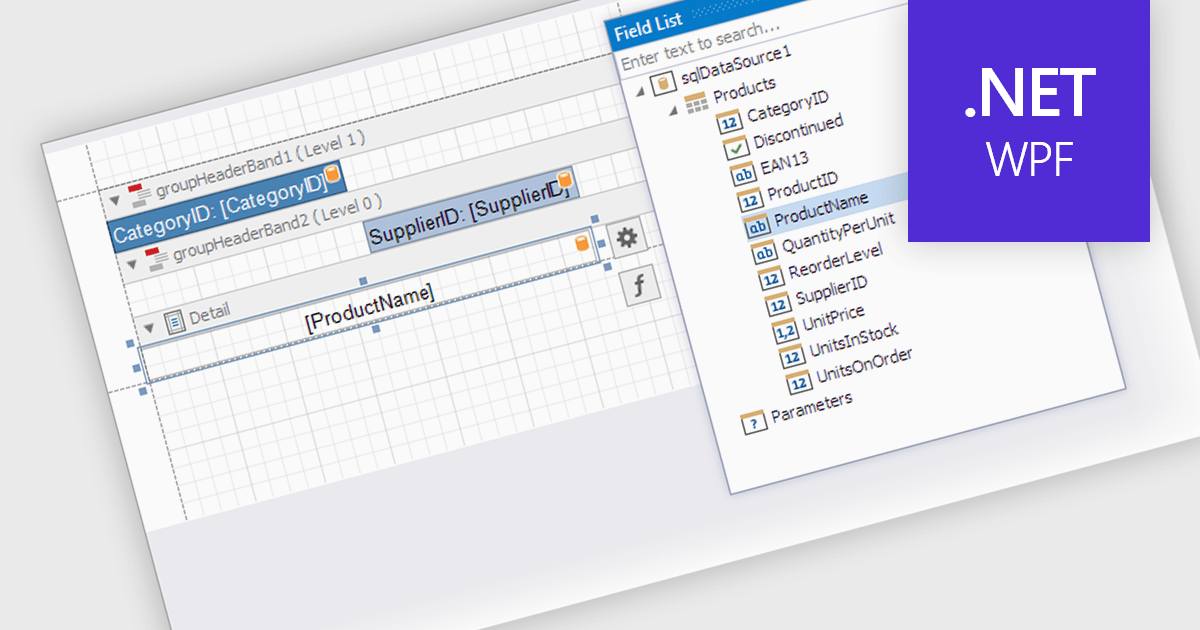
Data filtering and grouping in a .NET WPF reporting control are essential features that enable developers to organize, analyze, and present data effectively within an application. Data filtering allows users to specify criteria to display only relevant subsets of data, reducing noise and focusing on meaningful information. Grouping arranges data into categorized segments based on shared attributes, facilitating a structured and hierarchical view. These capabilities enhance user experience by making reports more intuitive and insightful while improving performance by minimizing data processing overhead. Together, filtering and grouping empower developers to create dynamic, user-friendly reports that meet diverse business requirements with precision and clarity.
Several .NET WPF reporting controls offer data filtering and grouping including:
For an in-depth analysis of features and price, visit our comparison of .NET WPF Reporting Controls.
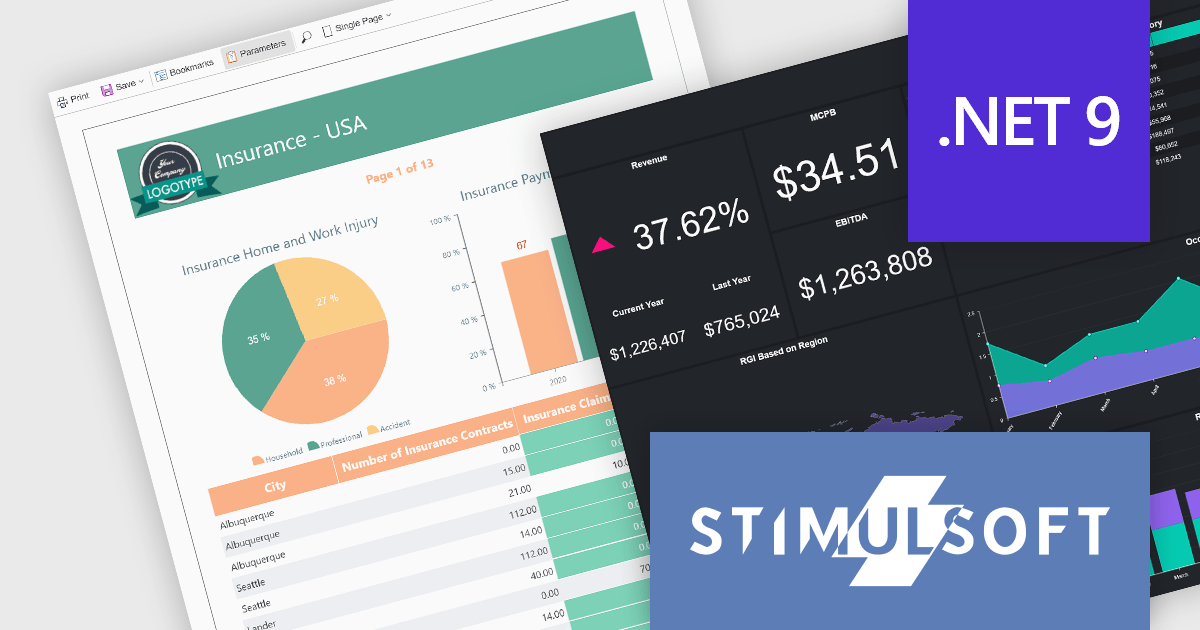
Stimulsoft offers a comprehensive suite of tools for creating interactive data visualizations. Stimulsoft Dashboards excels at crafting engaging dashboards for web and desktop applications, while Stimulsoft BI Designer provides a powerful platform for designing both reports and dashboards. Developers can seamlessly integrate these tools into their projects using platform-specific components or a centralized cloud designer, supporting .NET, JavaScript, PHP, and more. With rich data analysis capabilities, extensive customization options, and pre-built templates, Stimulsoft empowers you to transform complex data into clear, actionable insights for any audience.
The Stimulsoft 2024.4.5 release introduces full support for .NET 9, the latest version of Microsoft's widely used framework, empowering developers to create robust, high-performance reporting and data visualization solutions. With this update, users can harness the enhanced performance and features of .NET 9 while utilizing Stimulsoft's rich suite of tools for designing reports, building dashboards, and embedding advanced data analysis capabilities into their applications. This integration ensures seamless compatibility, enabling developers to deliver dynamic and interactive solutions with ease.
To see a full list of what's new in 2024.4.5, see our release notes.
Stimulsoft products are licensed per developer and are available as a perpetual license with 1 year support and maintenance. See our Stimulsoft Ultimate licensing page for full details.
For more information, visit our Stimulsoft product pages:
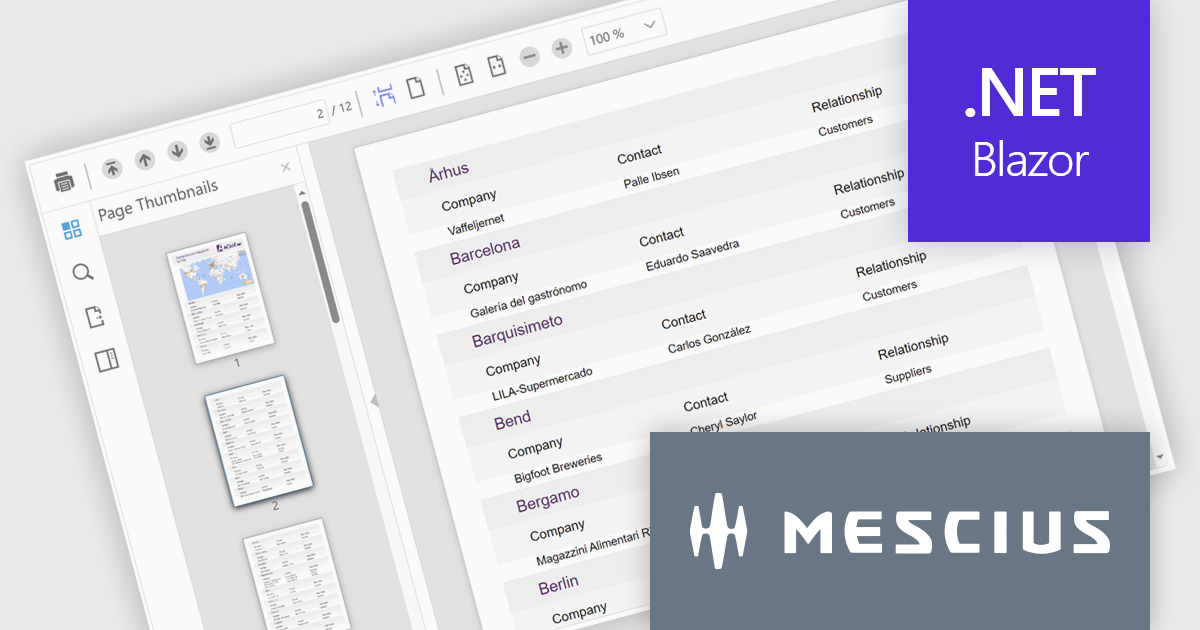
ComponentOne Studio Blazor Edition by MESCIUS empowers developers to leverage their existing C# skills to build rich web applications. This comprehensive suite includes high-performance, native Blazor UI controls like FlexGrid, a powerful datagrid with data virtualization, and 50+ chart types for data visualization. It also offers essential input controls like Autocomplete and Combobox, boosting development efficiency and creating a seamless experience for both developers and users.
The ComponentOne Studio Blazor Edition 2024 v2 update enhances productivity with the production-ready FlexViewer for Blazor Server applications, enabling developers to integrate a powerful cross-platform document and report viewer into their projects. This update introduces essential features such as a document outline for streamlined navigation, a page setup panel for effortless customization, and interactive report parameters for dynamic filtering. These additions simplify the management and presentation of complex documents and reports while ensuring a seamless user experience.
To see a full list of what's new in 2024 v2, see our release notes.
ComponentOne Studio Blazor Edition is licensed per developer on a perpetual basis and includes a 12 month subscription. See our ComponentOne Studio Blazor Edition licensing page for full details.
ComponentOne Studio Blazor Edition is available individually or as part of ComponentOne Studio Enterprise.
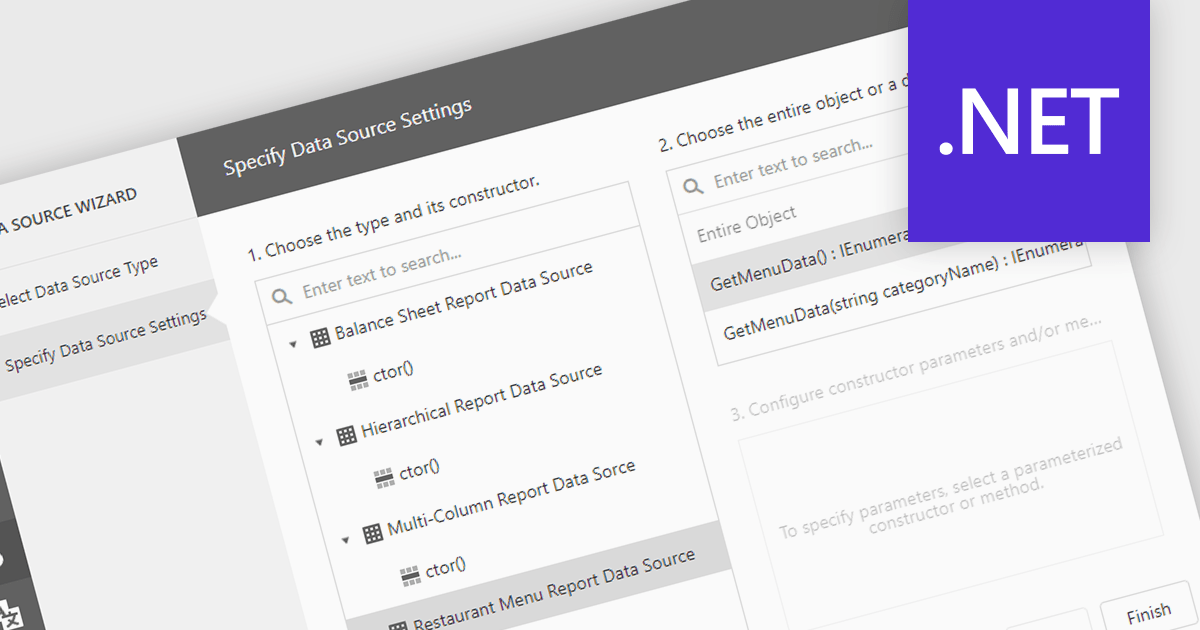
IEnumerable data connectivity allows for easy binding of reports to in-memory collections or objects that implement the IEnumerable interface, such as list
Several .NET reporting components offer IEnumerable data connectivity including:
For an in-depth analysis of features and price, visit our comparison of .NET reporting controls.
電話: (888) 850 9911
Fax: +1 770 250 6199


