













公式サプライヤー
公式および認定ディストリビューターとして200社以上の開発元から正規ライセンスを直接ご提供いたします。
当社のすべてのブランドをご覧ください。
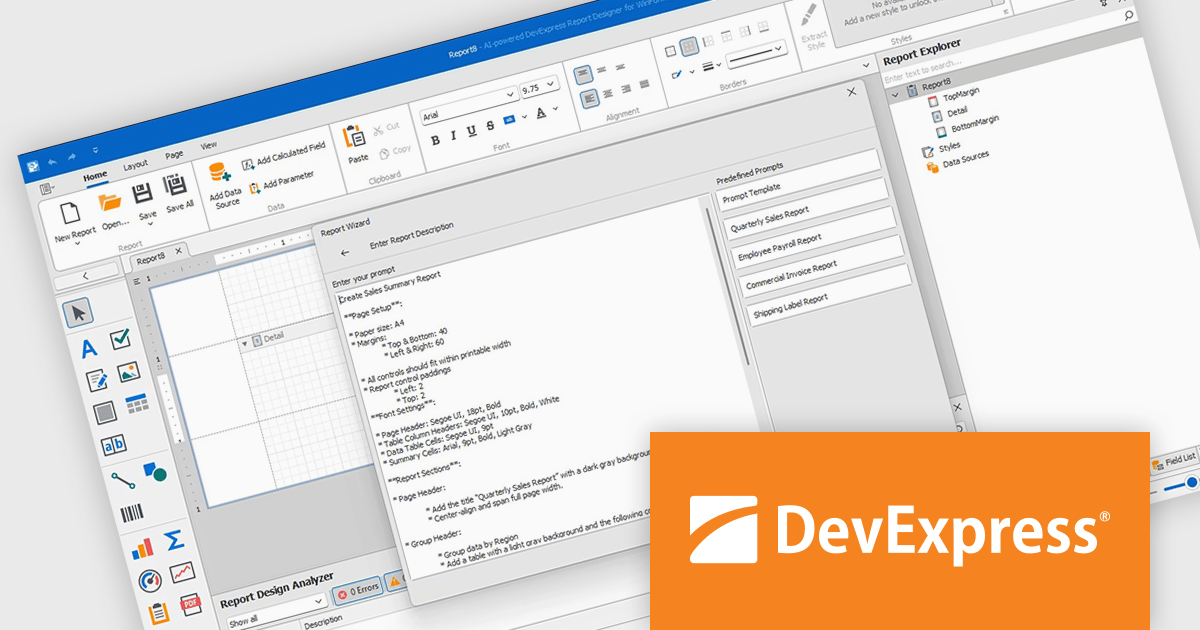
DevExpress Reporting is a comprehensive suite of reporting tools that empowers developers to create visually stunning and highly customizable reports for various applications. With its rich feature set, including data binding, layout design, printing, and exporting capabilities, DevExpress Reporting enables the efficient creation of reports that meet the most demanding business requirements.
The DevExpress Reporting v25.1 update introduces a new AI-powered Report Wizard (currently in Community Technology Preview), bringing natural language capabilities directly into the report design workflow. By allowing users to describe the report they need in plain text, the wizard interprets this input and automatically generates a matching report layout. This greatly reduces the time and expertise required to design reports, particularly for users who may not be familiar with the underlying report schema or expression syntax. It’s especially useful for quickly prototyping reports or enabling non-technical users to contribute to report design without writing code or manually configuring elements.
To see a full list of what's new in version 25.1, see our release notes.
DevExpress Reporting is licensed per developer and is available as a Perpetual License with a 12 month support and maintenance subscription. See our DevExpress Reporting licensing page for full details.
DevExpress Reporting is available to buy in the following products:
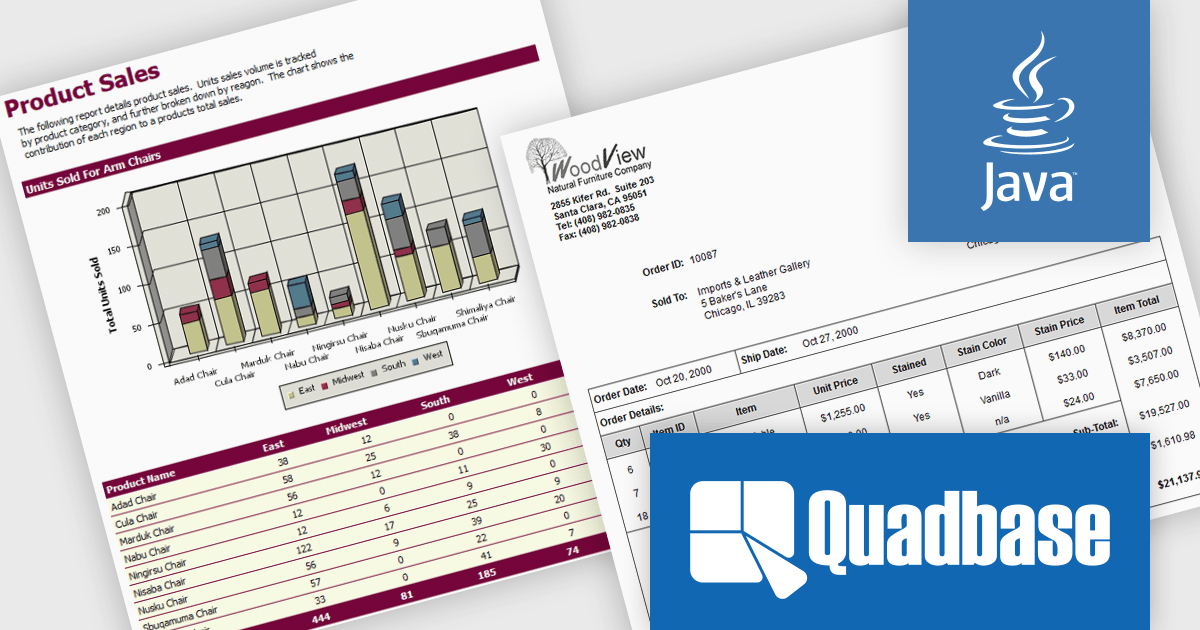
EspressReport by Quadbase Systems is a robust Java-based reporting and business intelligence solution designed for integration into applications, servlets, and JSP environments. With a comprehensive visual report designer and a rich API toolkit, EspressReport enables users to create dynamic and interactive reports tailored to enterprise needs. Its cross-platform compatibility makes it a flexible choice for organizations operating across a variety of system environments, including Windows, Linux, macOS, and Unix.
EspressReport offers a powerful set of features that support versatile data connectivity, advanced charting capabilities, and a wide range of output formats such as PDF, Excel, and HTML. Users benefit from intuitive visual design tools, multi-source data integration, and customizable report parameters, making it suitable for both technical developers and business users. Common use cases include financial reporting, operational reports, data visualization, and scheduled report distribution, helping organizations transform raw data into clear, actionable insights.
EspressReport is available as either a Development License or a Server/Deployment License. The Development License allows one developer to install and use the design tools on a single machine for development purposes. It does not permit any deployment or distribution of applications. The Server/Deployment License, is designed for running EspressReport-based solutions in server environments, including applications, servlets, and JSPs, and is priced per server CPU. Licenses come with Annual Support & Maintenance for email/phone support, patches, and upgrades. See our EspressReport licensing page for full details.
For more information visit our EspressReport product page.
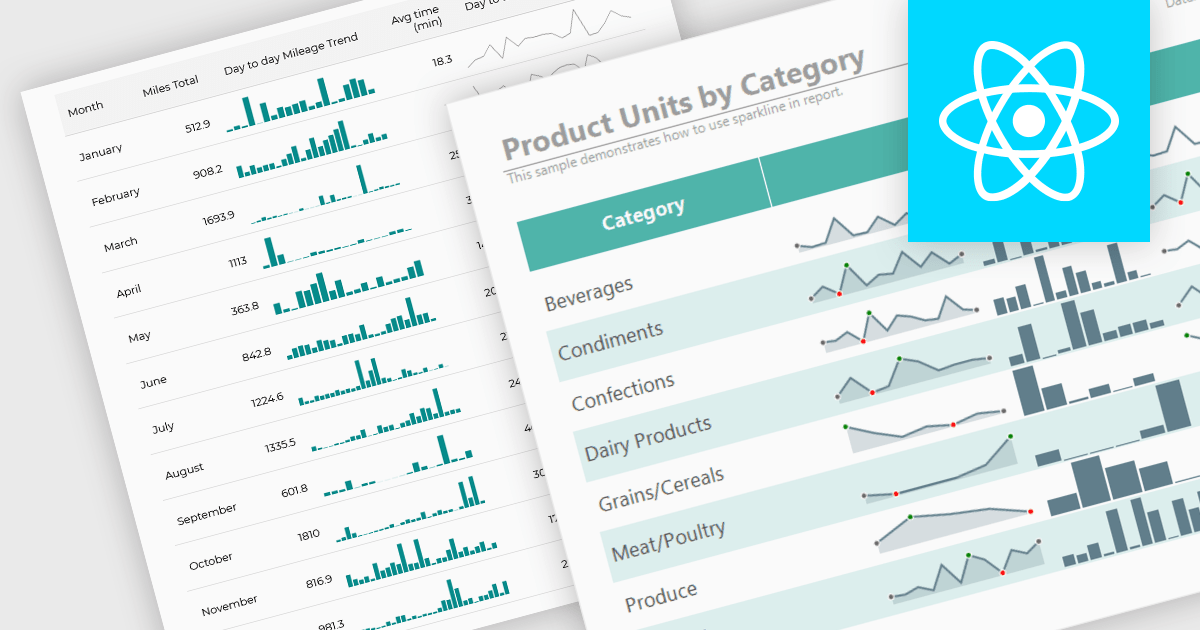
Sparklines are compact, data-rich graphics embedded within reports to illustrate trends, variations, or patterns over time. These miniature charts, typically rendered as lines, columns, or bars, offer a concise visual summary without the need for full-scale graphs. By integrating sparklines directly into data tables or summaries, reporting tools enable users to quickly grasp performance metrics or fluctuations at a glance, enhancing the interpretability of complex datasets.
Several React reporting controls offer sparklines including:
For an in-depth analysis of features and price, visit our React reporting controls comparison.
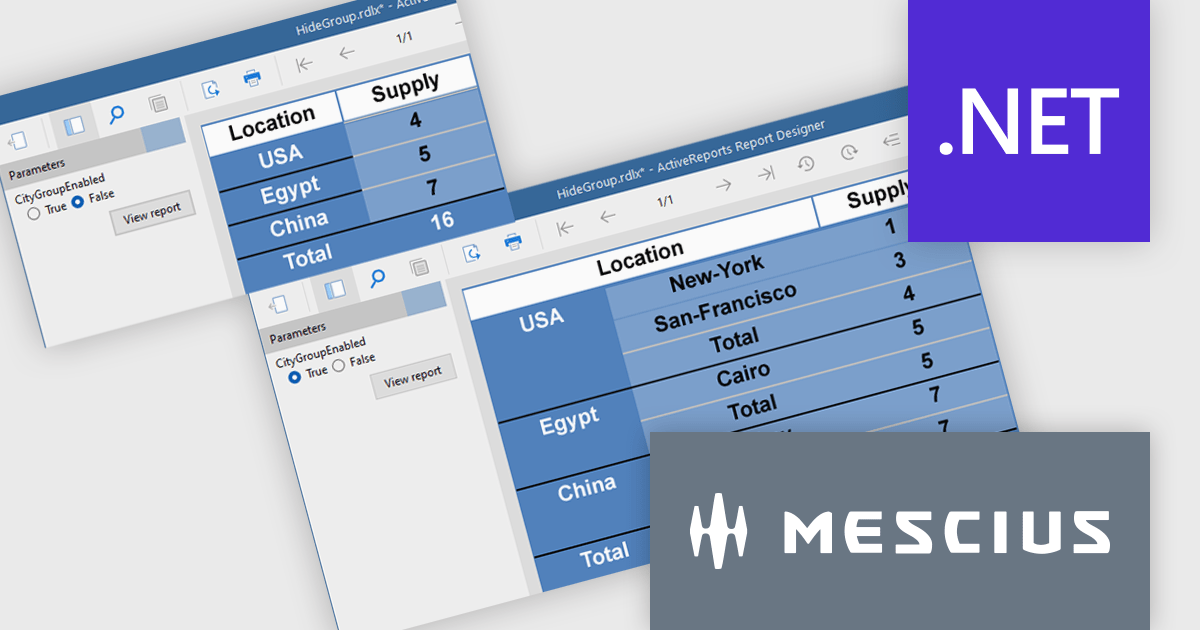
ActiveReports.NET from MESCIUS, is a comprehensive reporting solution for developers building applications in .NET. It empowers you to design and deliver visually appealing reports through user-friendly designers and a wide range of controls. ActiveReports simplifies report creation and distribution with a versatile API, rich data source connectivity, and support for multiple export formats. This translates to increased developer productivity and improved end-user experience with powerful reporting functionalities within your .NET applications.
The ActiveReports v19.1 update introduces enhanced grouping control that allows developers to enable or hide groups in Tables, BandedLists, and Tablix controls based on expressions or parameters. This capability makes it easier to design reports that adapt at runtime to different data scenarios or user inputs, without requiring code changes. By configuring the new "Enabled" and "Hidden" properties directly within the report definition, developers can deliver more flexible and maintainable reporting solutions that respond dynamically to business logic.
To see a full list of what's new in v19.1, see our release notes.
ActiveReports.NET is licensed per developer and is available with or without a 12 month support and maintenance subscription. See our ActiveReports.NET licensing page for full details.
Learn more on our ActiveReports.NET product page.
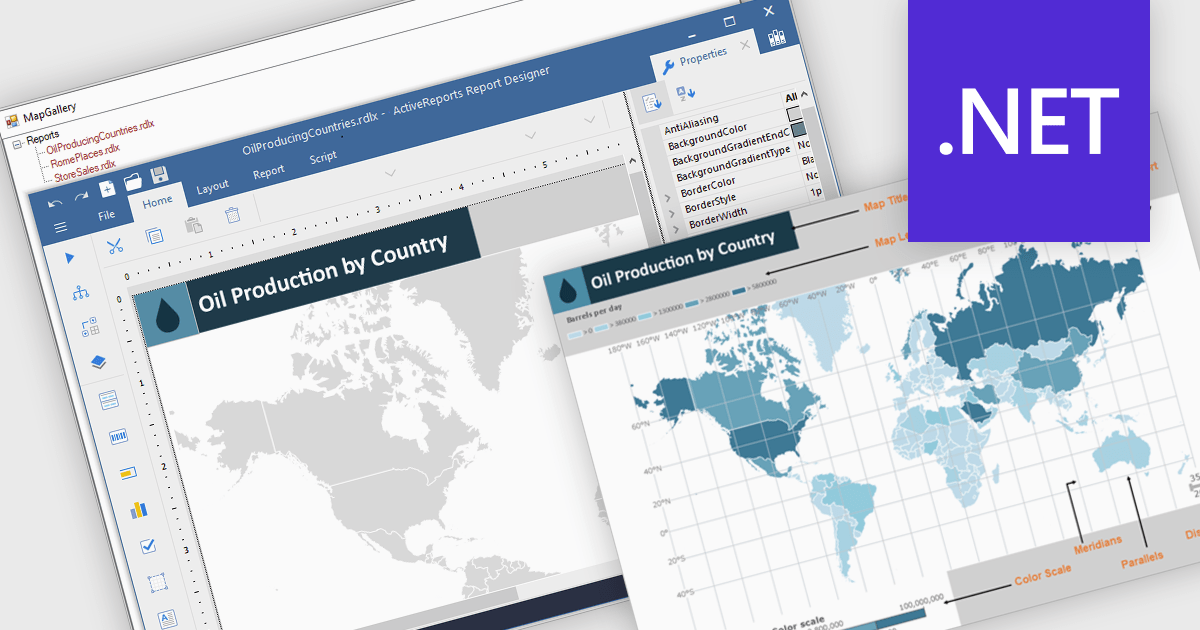
Maps in reports are visual tools that display geographic data, allowing users to see where activities, trends, or values occur across specific regions. By translating complex location-based information into clear and intuitive visuals, maps enhance understanding, highlight spatial patterns, and reveal insights that might be missed in tables or charts. This added layer of geographic context supports more informed decision-making and more compelling data storytelling. Common use cases include tracking regional sales performance, mapping customer distribution, analyzing service coverage, and presenting market expansion opportunities. Whether static or interactive, maps make reports more engaging and impactful for both technical and non-technical audiences.
Several .NET reporting controls offer maps, including:
For an in-depth analysis of features and price, visit our comparison of .NET reporting controls.
電話: (888) 850 9911
Fax: +1 770 250 6199


