


公式サプライヤー
公式および認定ディストリビューターとして200社以上の開発元から正規ライセンスを直接ご提供いたします。
当社のすべてのブランドをご覧ください。
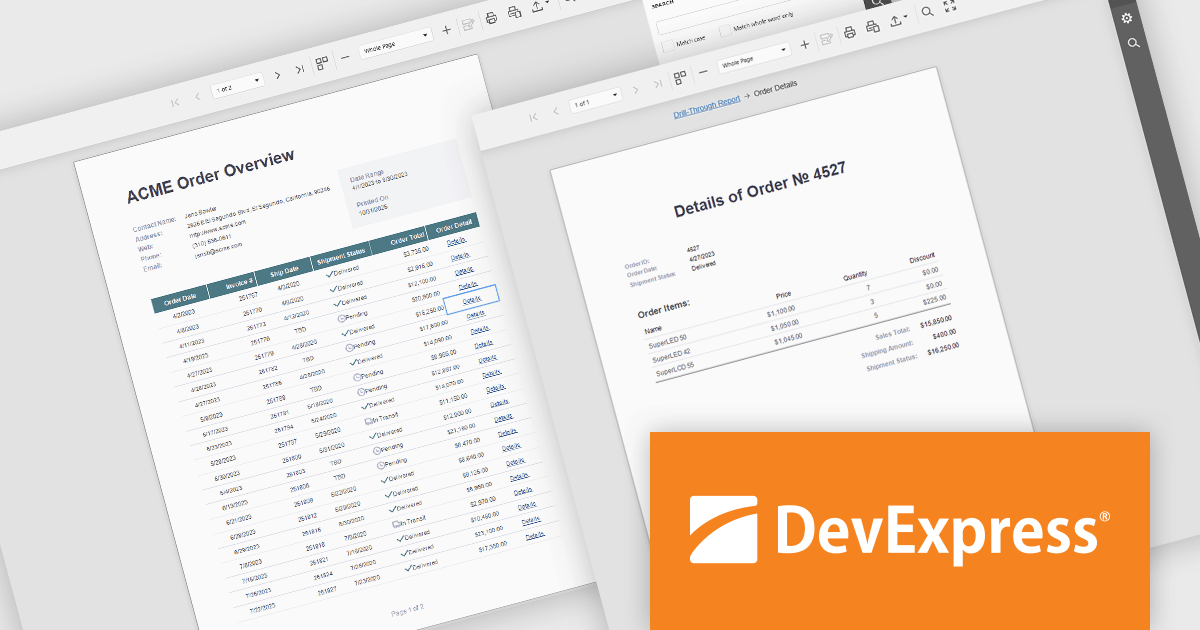
DevExpress Reporting is a comprehensive suite of reporting tools that help developers create visually stunning and highly customizable reports for various applications. With its rich feature set, including data binding, layout design, printing, and exporting capabilities, DevExpress Reporting enables the efficient creation of reports that meet the most demanding business requirements.
DevExpress Reporting enhances data analysis by enabling drill-through reports, allowing developers to create interactive report designs that link summary-level data to detailed information. This feature provides a streamlined way for users to explore data hierarchies without leaving the main report, improving usability and workflow efficiency. By clicking on data points, users can view related details in a connected report, ensuring a cohesive and intuitive data exploration experience. This capability helps developers deliver more dynamic, context-rich reporting solutions that support faster and more informed decision-making.
DevExpress Reporting is licensed per developer and is available as a Perpetual License with a 12 month support and maintenance subscription. See our DevExpress Reporting licensing page for full details.
DevExpress Reporting is available to buy in the following products:
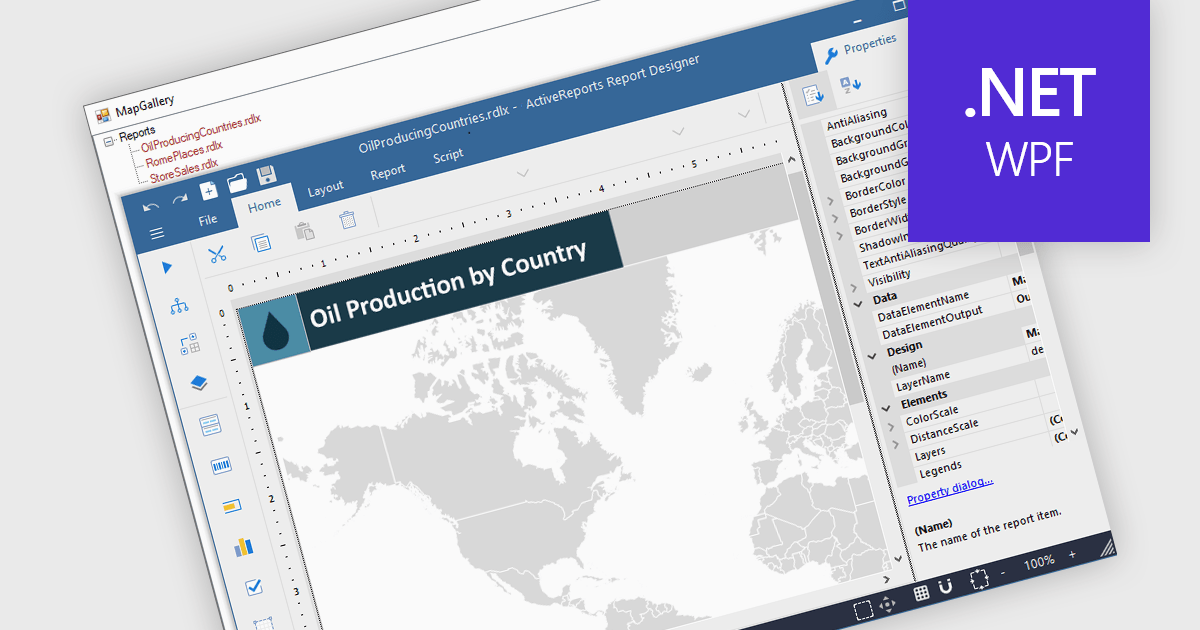
Maps in reports enable data to be visualized geographically, turning raw numbers into clear, location-based insights that are easy to interpret. By integrating maps, reports can highlight regional trends, patterns, and relationships that might be overlooked in traditional charts or tables. This spatial perspective supports better decision-making by revealing where performance is strongest, where opportunities exist, and where challenges may be emerging. Common use cases include visualizing sales performance by region, tracking service coverage areas, monitoring logistics routes, and presenting demographic or environmental data. Incorporating maps adds depth, context, and visual appeal, making reports more informative and engaging for any audience.
Several .NET WPF reporting controls offer maps, including:
For an in-depth analysis of features and price, visit our comparison of .NET WPF reporting controls.
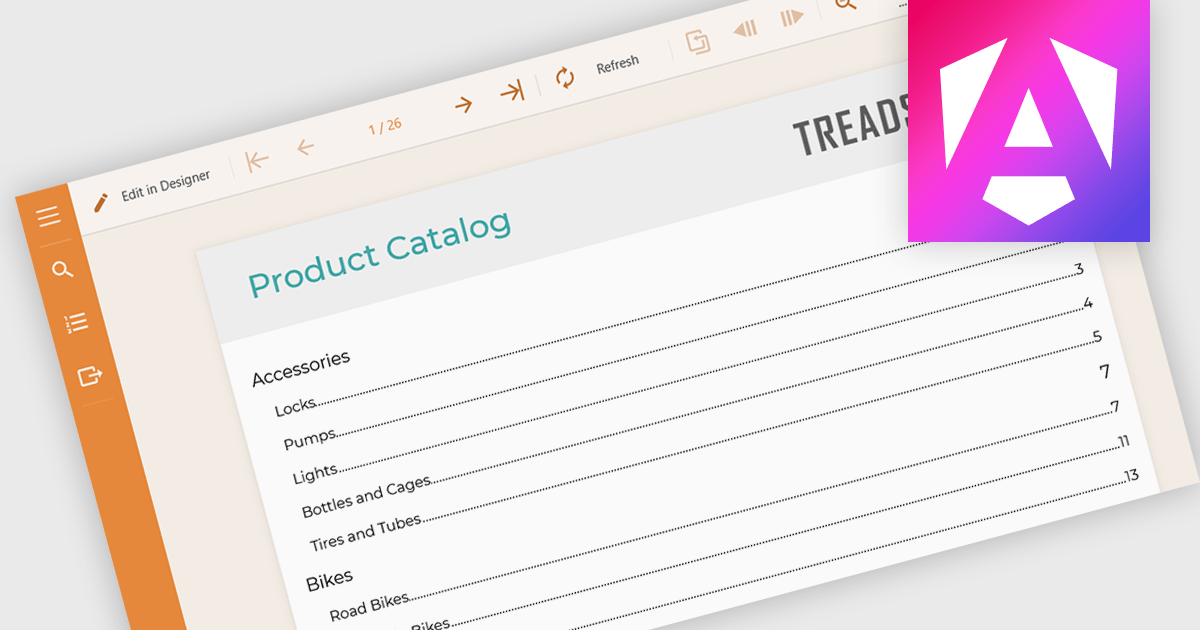
Table of Contents (TOC) support in a reporting component allows developers to automatically generate a structured overview of a report’s sections, typically displayed at the beginning of the document. This feature helps users navigate long or complex reports by providing direct links or page references to key sections, mirroring the layout and hierarchy of the report's content. For developers, it reduces the need to manually maintain navigation aids, improves the report’s usability, and enhances the professional appearance of exported formats like PDF or Word. TOC support is especially beneficial in compliance-heavy or audit-focused applications where clear documentation structure is essential.
Several Angular reporting controls offer Table of Contents (TOC) support including:
For an in-depth analysis of features and price, visit our comparison of Angular reporting controls.
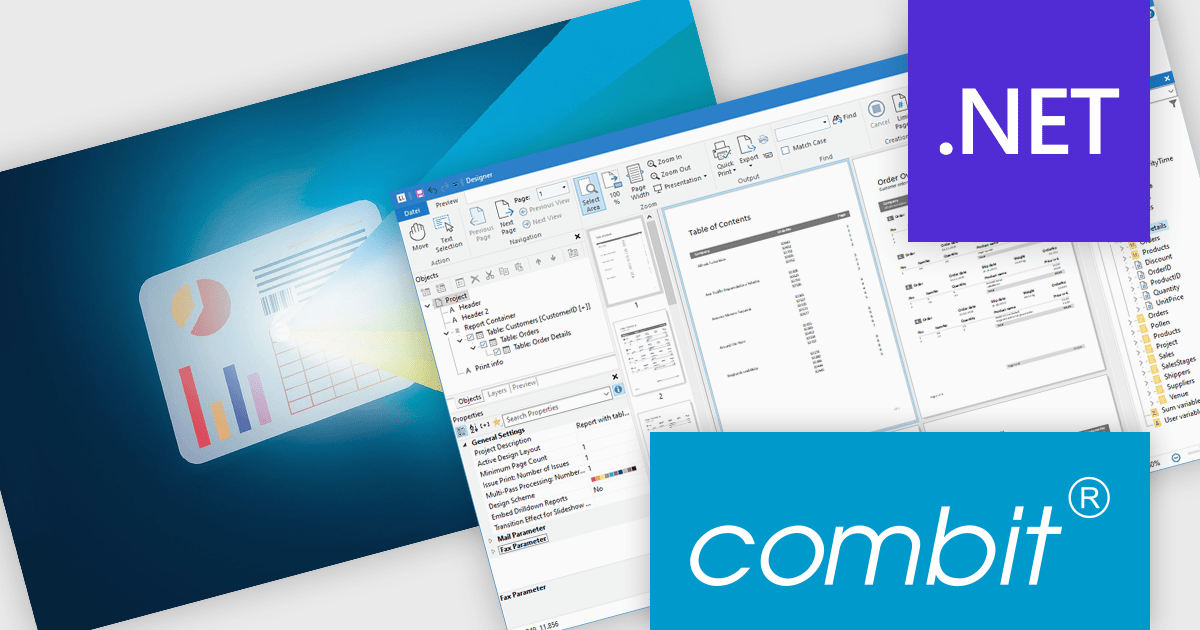
List & Label by combit is a software development toolkit that empowers developers to integrate comprehensive reporting functionalities into their desktop, web, and cloud applications. It offers features such as data binding, complex data visualization, and a user-friendly report designer, along with printing, exporting, and previewing capabilities. List & Label operates independently of programming languages and data sources, providing developers with the flexibility to design and deliver informative reports within their development environment.
The List & Label 31 update introduces cross-platform reporting, enabling developers to design, generate, and distribute reports across Windows, macOS, Linux, and web environments. This enhancement ensures consistent performance, layout accuracy, and data representation on every platform while reducing the need for multiple platform-specific implementations. By unifying the reporting process within a single framework, developers can deliver a cohesive reporting experience to all users, regardless of their operating system.
To see a full list of what's new in version 31, see our release notes.
List & Label is licensed per developer and is available as a Perpetual License with a 12 month support and maintenance subscription. See our List & Label licensing page for full details.
For more information, visit our List & Label Enterprise Reporting Edition product page.
ActiveReportsJS is a robust JavaScript reporting tool that enables developers and report authors to seamlessly design and integrate interactive reports into web applications. It offers advanced features such as drill-down capabilities, runtime data filtering, and interactive parameters, enhancing the functionality and usability of reports. With compatibility across popular frameworks and the flexibility of its report designer component, ActiveReportsJS simplifies the visualization of diverse data sets, making it ideal for applications that require financial reporting, such as balance sheets, and other dynamic reporting needs.
In this blog post, MESCIUS Product Manager Joel Parks highlights real-world scenarios in where you can use ActiveReportsJS to provide users with the capability to define data sources on the fly, using Runtime Data Binding to dynamically inject data into your Angular Reporting component at runtime. Steps include:
This powerful capability gives your application the flexibility to generate customized reports based on user input, server logic, or changing data sources, without forcing the report designer to predefine every field.
Read the full blog to get started building powerful, dynamic reports.
ActiveReportsJS is licensed on an annual subscription or perpetual basis and is available as a Single Deployment License for non-commercial use, and as a Single Domain License or Unlimited Domain License for commercial and/or SaaS use. See our ActiveReportsJS licensing page for full details.
For more information, visit our ActiveReportsJS product page.
電話: (888) 850 9911
Fax: +1 770 250 6199


