













公式サプライヤー
公式および認定ディストリビューターとして200社以上の開発元から正規ライセンスを直接ご提供いたします。
当社のすべてのブランドをご覧ください。
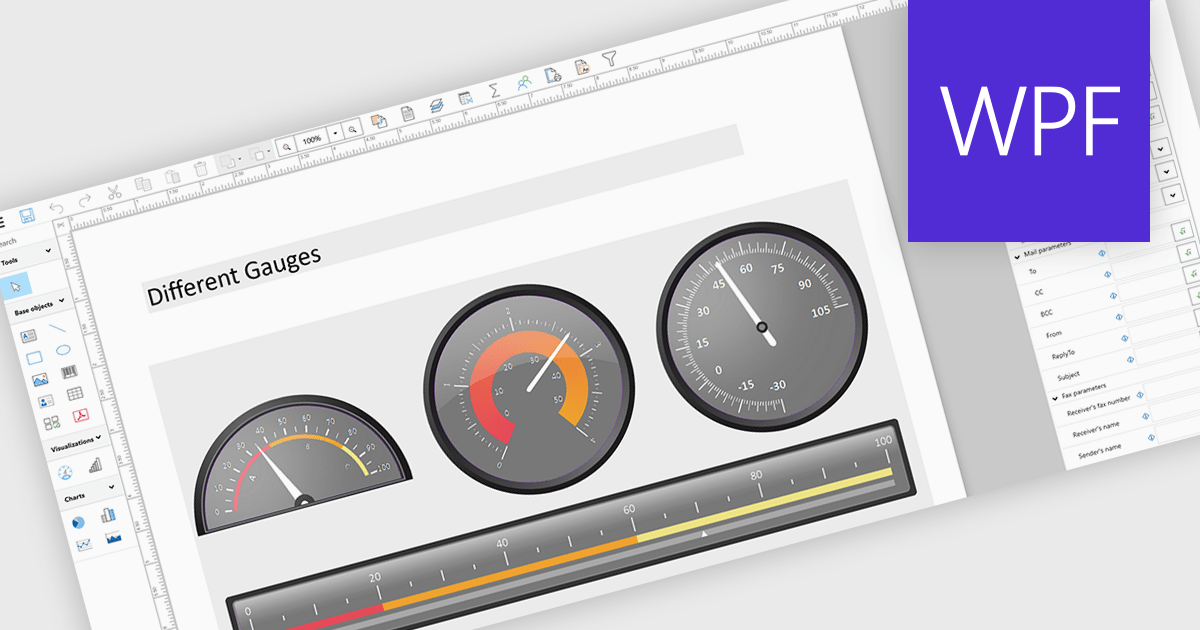
Adding gauges to reports means incorporating visual indicators such as dial or meter style graphics that display key metrics against defined ranges or targets, making performance instantly understandable at a glance. This approach enhances report clarity by transforming complex or dense data into intuitive visuals, helping users quickly assess whether values fall within acceptable, warning, or critical thresholds. As a result, gauges support faster, more informed decision making, improve stakeholder communication, and create more engaging, user friendly reports. Common use cases include tracking sales performance against quotas, monitoring system health or uptime, visualizing budget utilization, and displaying KPI progress in executive dashboards where quick insights are essential.
Several .NET WPF Reporting controls include Gauges including:
For an in-depth analysis of features and price, visit our comparison of .NET WPF Reporting Controls.
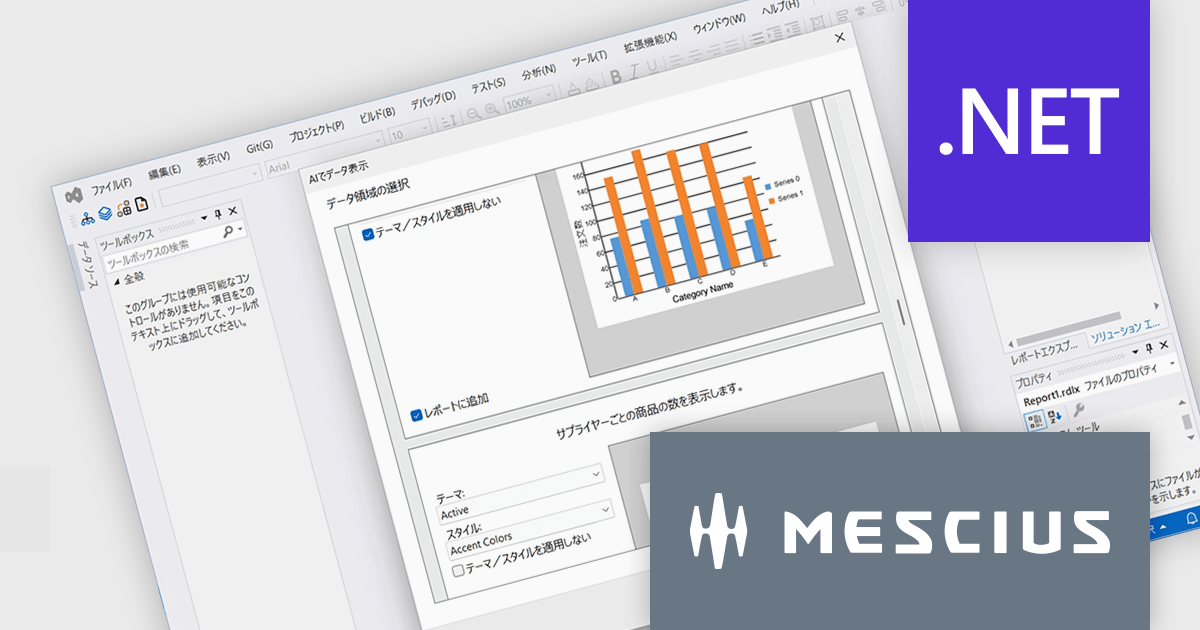
ActiveReports for .NETは、Visual Studio上で帳票アプリケーションを開発できる.NET開発コンポーネントです。Windowsフォーム、WPF、ASP.NET、ASP.NET Core、Blazorの5つのプラットフォームをサポートし、レイアウトや書式といった外観デザインの設定から、データ接続、印刷およびPDFへの出力設定まで、帳票開発に必要なあらゆる機能を備えています。
ActiveReports for .NET 20.0Jでは、AIを活用した帳票開発支援機能が強化され、設計工程の効率化が大きく進みました。主な特徴の一つは、帳票画像をもとにレイアウトを自動生成する機能です。画像を解析し、テキストや罫線、各種コントロールを適切に配置することで、従来手作業で行っていた設計の初期工程を短縮できます。さらに、AIがデータ構造を理解し、レポート作成時の設定を提案する機能も追加されました。なお、最新の.NET 10およびVisual Studio 2026にも対応しており、最新の開発環境で帳票アプリケーションを構築できるようになりました。
20.0Jでの新機能一覧は、リリースノートを参考ください。
本製品のライセンスは、開発者ごとに付与されるユーザーライセンスで、対象開発者は最大3台のマシンにインストール可能です。本製品の機能を組み込んで開発したクライアントサイドアプリケーションはランタイムライセンスは不要です。ただし、サーバーサイドアプリケーションを運用環境へ配布の際には”コアサーバーライセンス”が必要です。なお、年間保守サービスが付属しており、無償バージョンアップや日本語によるE-mail技術サポートを無制限に受けることができます。詳細は、ActiveReports for .NETのライセンスページをご参照ください。
ActiveReports for .NETの製品詳細及び販売情報は、下記の各エディション別の専用ページをご参考ください。
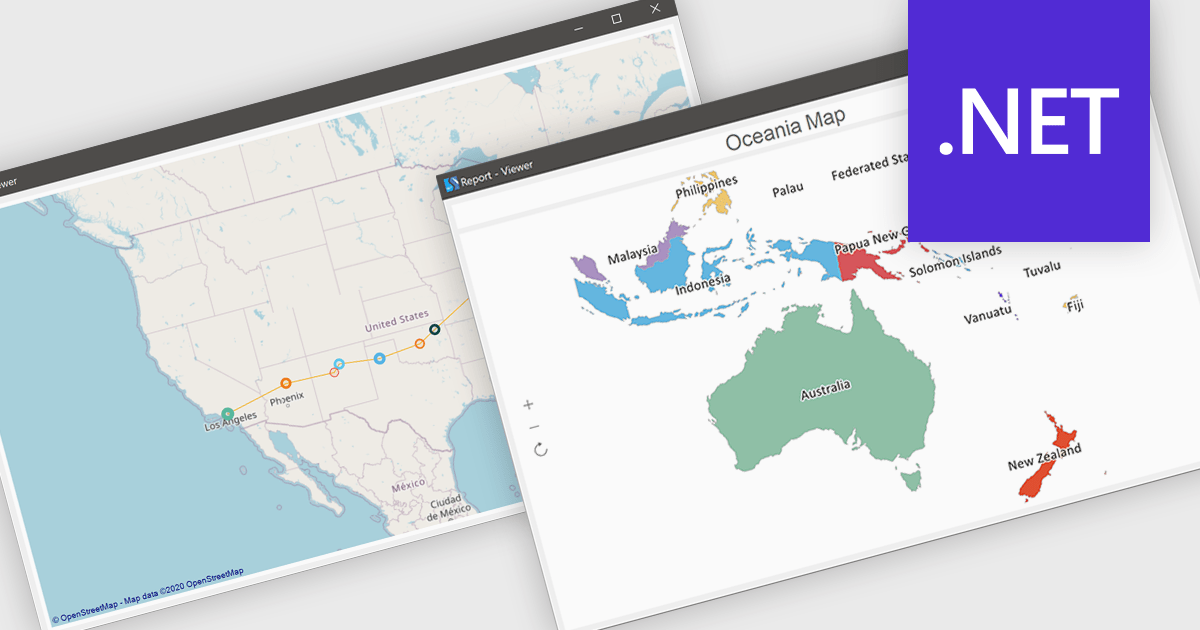
Maps in reports enable data to be visualized geographically, allowing information to be presented in the context of location rather than in traditional tables or charts. By transforming complex datasets into intuitive map-based visuals, this feature makes it easier to identify regional trends, compare performance across territories, and uncover patterns that might otherwise go unnoticed. It enhances data storytelling by providing a clear and engaging way to communicate insights, while also supporting faster, more informed decision-making. Common use cases include analyzing sales performance by region, tracking customer demographics, monitoring delivery logistics, and evaluating market opportunities across different areas.
Several .NET reporting controls offer maps, including:
For an in-depth analysis of features and price, visit our comparison of .NET reporting controls.
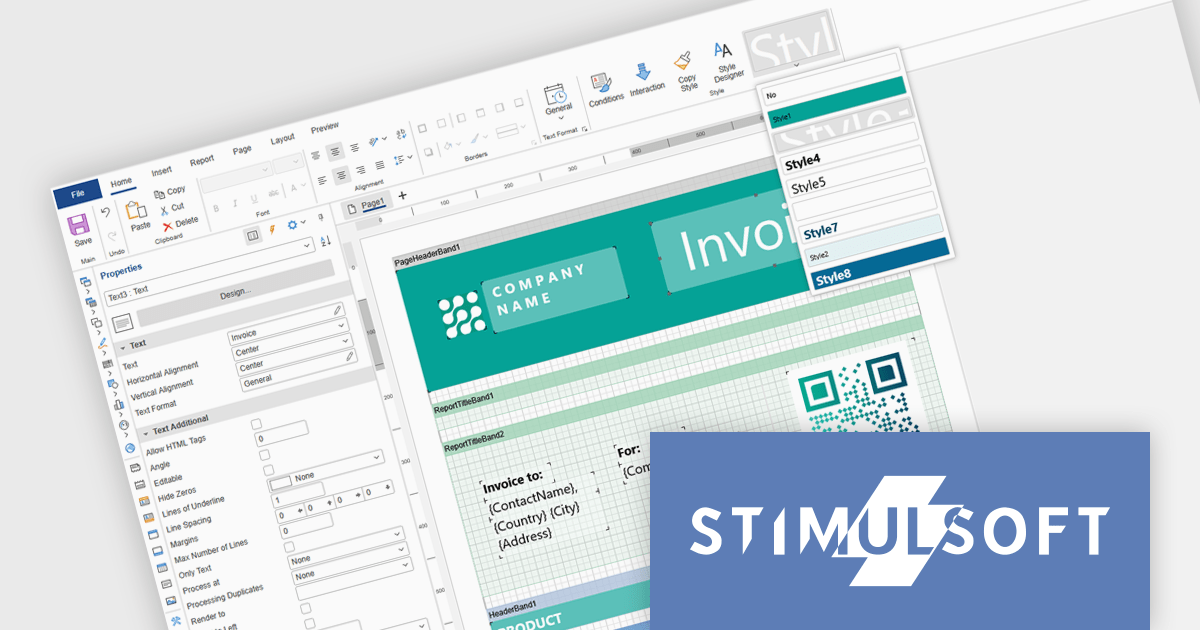
Stimulsoft Ultimate is a reporting and dashboard solution that provides a set of tools for building interactive reports and data visualizations across platforms, including WinForms, ASP.NET, .NET Core, Blazor, JavaScript, WPF, PHP, Java, and Avalonia. It enables developers and organizations to design, generate, and deploy professional reports and dashboards using visual designers, flexible styling options, rich charting and data visualization components, and extensive data connectivity. With support for multiple development environments and technologies, Stimulsoft Ultimate helps teams improve report creation, maintain consistent designs, and deliver clear, data-driven insights for business intelligence, analytics, operational reporting, and enterprise applications.
Stimulsoft Ultimate enables developers to apply centralized report styling that ensures consistent formatting across report elements while reducing the time required to design and maintain reports. By using reusable styles for fonts, colors, borders, and other visual properties, developers can standardize report layouts, quickly apply formatting to multiple components, and implement global design changes without editing each element individually. This approach improves development efficiency, simplifies maintenance, and helps teams deliver professional, visually consistent reports across applications and platforms.
Stimulsoft Ultimate is licensed per developer with Single, Team, Enterprise, and WorldWide options that support one to unlimited developers within an organization. Licenses include a 12 month subscription with updates, priority technical support, a royalty free runtime report designer and viewer, and a build server license for Team and higher tiers. See our Stimulsoft Ultimate licensing page for full details.
For more information, visit our Stimulsoft Ultimate product page.
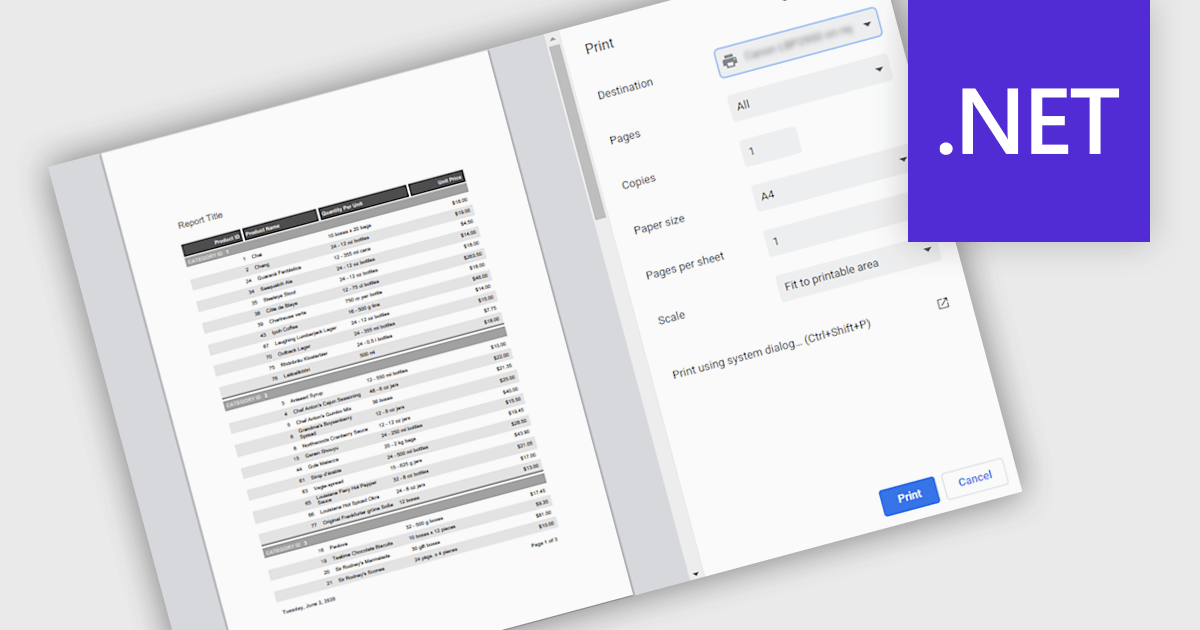
Printing reports allows users to generate physical copies of structured data, summaries, or analysis directly from an application. By converting digital information into printed documents, users can easily review content offline, share insights in meetings, and maintain clear records for documentation or compliance. Printed reports provide a consistent layout that improves readability and makes complex information easier to present to stakeholders who may prefer or require hard copies. Common use cases include distributing reports during team meetings, preparing documentation for audits or regulatory requirements, archiving important records, and sharing key findings with clients or decision-makers in a clear and professional format.
Several .NET reporting components support printing including:
For an in-depth analysis of features and price, visit our .NET reporting comparison.
電話: (888) 850 9911
Fax: +1 770 250 6199


