


公式サプライヤー
公式および認定ディストリビューターとして200社以上の開発元から正規ライセンスを直接ご提供いたします。
当社のすべてのブランドをご覧ください。
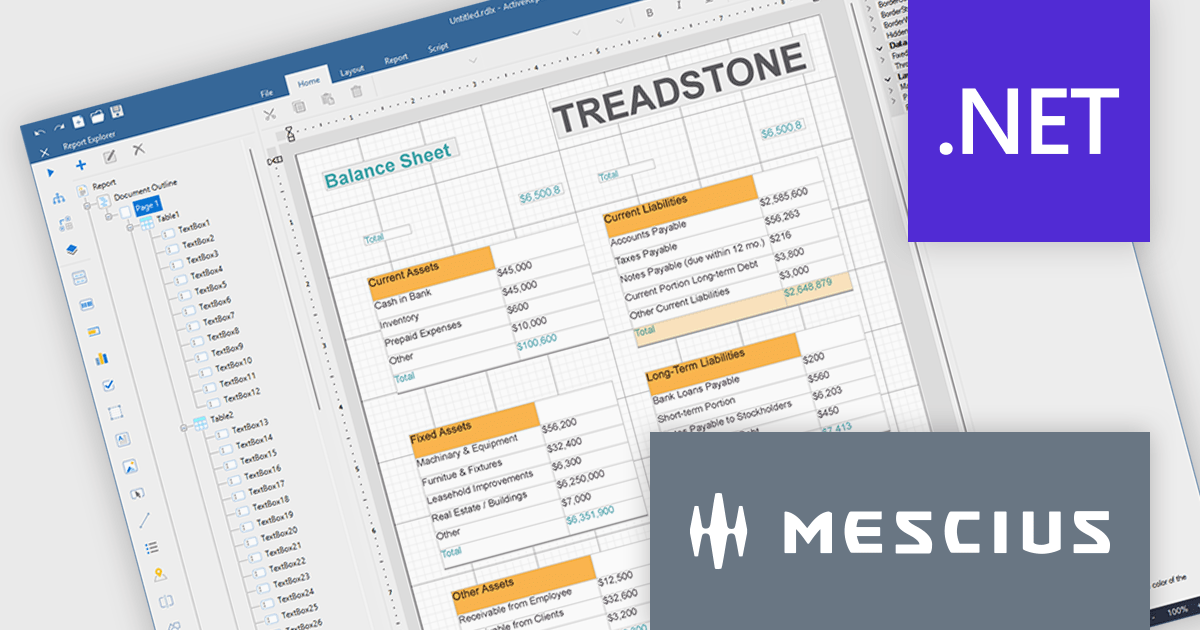
ActiveReports.NET helps you deliver beautiful reports with intuitive Visual Studio integrated report designers and rich controls. ActiveReports provides code-based cross-platform reporting, easy-to-use designers, and a flexible API. MESCIUS recently released ActiveReports.NET v20, which includes the powerful AI Image to report feature.
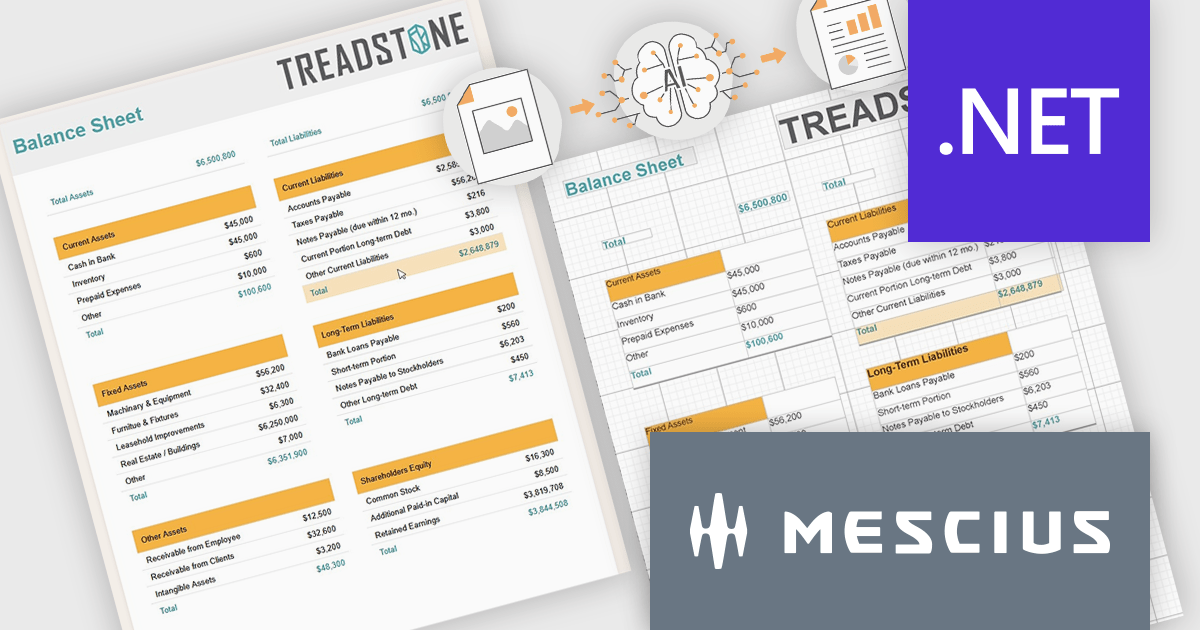
In this blog post, MESCIUS Product Manager Alec Gall presents a detailed walkthrough for creating a report from an image in the Designer. Steps include:
Read the full blog to learn how to turn screenshots, scans, and even photographs of reports into editable .NET RDL reports.
ActiveReports.NET is licensed per developer. Dependent on geographic location it is available as either an Annual (Timed) Subscription License or as a Perpetual Developer License which comes with 1 year of software updates and support. Each developer requires a license to design, develop, or maintain applications. The Annual Subscription License must be renewed each year to continue to work with the software. Published applications are royalty free and do not expire. Optional pipeline licenses available for CI/CD build servers. See our ActiveReports.NET licensing page for full details.
Learn more on our ActiveReports.NET product page.
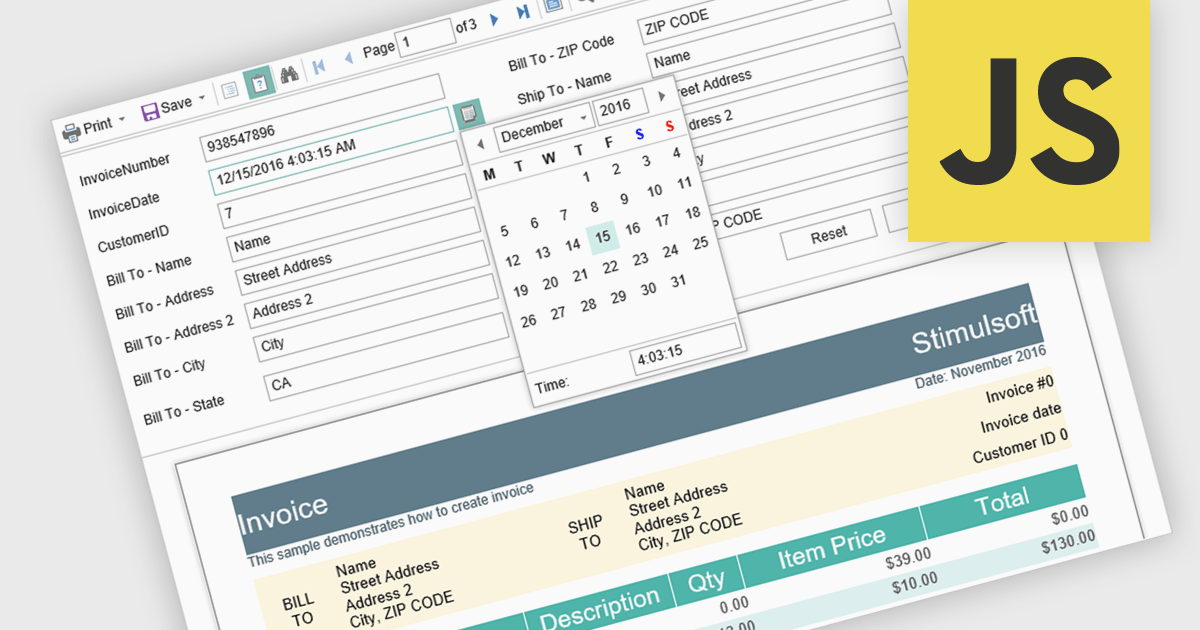
Parameter support in a reporting component refers to the ability to define input variables that control how a report is generated at runtime. These parameters can be used to filter data, adjust date ranges, select categories, or toggle specific report options without modifying the underlying report design or query logic. For software developers, this capability enables the creation of reusable and adaptable reports that respond dynamically to user input or application context. It improves maintainability by separating report structure from variable inputs, reduces duplication by allowing a single report definition to serve multiple scenarios, and enhances integration with applications by supporting programmatic parameter binding through application programming interfaces (APIs).
Several JavaScript reporting components support report parameters including:
For an in-depth analysis of features and price, visit our JavaScript reporting comparison.
ActiveReports.NET by MESCIUS is a reporting solution for the Microsoft .NET platform that enables developers to create and deliver data-driven reports in web, desktop, and cloud applications. It supports multiple report types, including section, page, and RDL (Report Definition Language) reports, and provides visual designers, a robust rendering engine, and export options such as PDF and Excel. Designed to integrate with modern .NET and ASP.NET Core applications, it helps teams build interactive, enterprise-grade reporting features into their software.
The ActiveReports.NET v20 update introduces a new AI powered image to report capability that enables developers to convert static report images such as screenshots, mockups, PDFs, or even photos of printed pages into fully editable report layouts in minutes. By leveraging Azure Document Intelligence to analyze page structure, text, and visual elements, it significantly reduces the manual effort required to recreate existing reports, accelerates the modernization of legacy assets, and streamlines migrations from other reporting platforms. This capability provides a practical starting point for rebuilding or refining reports while preserving full control over layout structure, styling, grouping, and data bindings to ensure alignment with application architecture and development standards.
To see a full list of what's new in v20, see our release notes.
ActiveReports.NET is licensed per developer. Dependent on geographic location it is available as either an Annual (Timed) Subscription License or as a Perpetual Developer License which comes with 1 year of software updates and support. Each developer requires a license to design, develop, or maintain applications. The Annual Subscription License must be renewed each year to continue to work with the software. Published applications are royalty free and do not expire. Optional pipeline licenses available for CI/CD build servers. See our ActiveReports.NET licensing page for full details.
Learn more on our ActiveReports.NET product page.
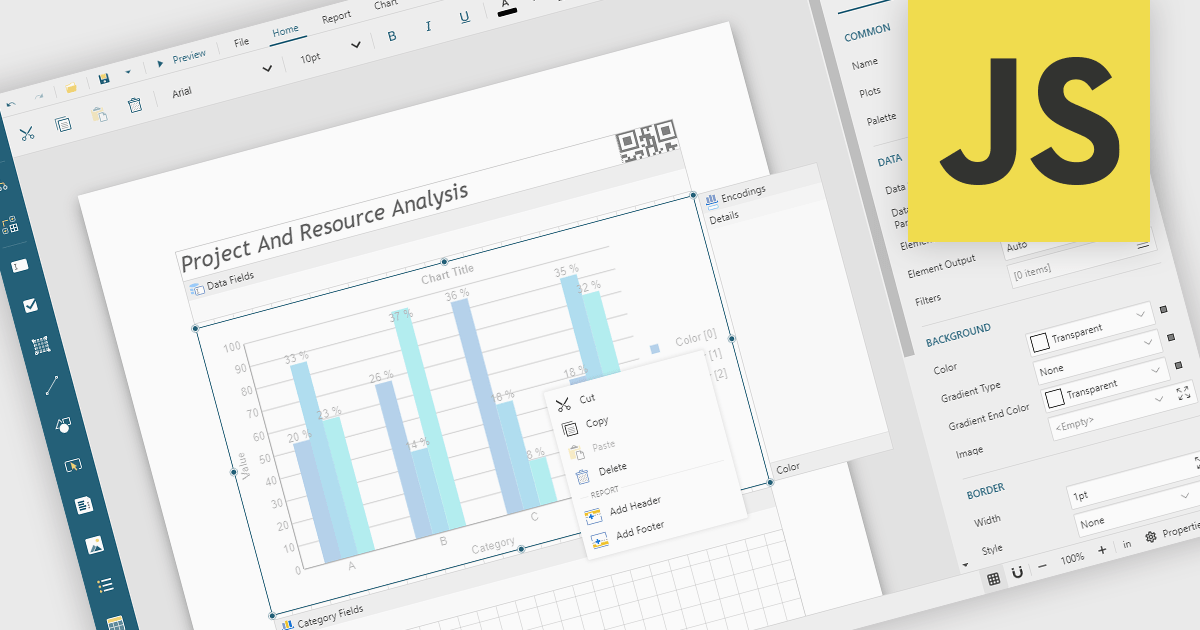
A Visual Report Designer is an application that enables users to create interactive, analytical, and print-ready reports using an intuitive, drag-and-drop interface. It supports fully customizable templates and data visualization components, helping teams present complex information clearly while maintaining consistent branding and layouts. Typical use cases include executive dashboards, financial and operational reports, customer analytics summaries, compliance documents, and branded client-facing reports.
Several JavaScript reporting components offer visual report designers including:
For an in-depth analysis of features and price, visit our JavaScript reporting comparison.
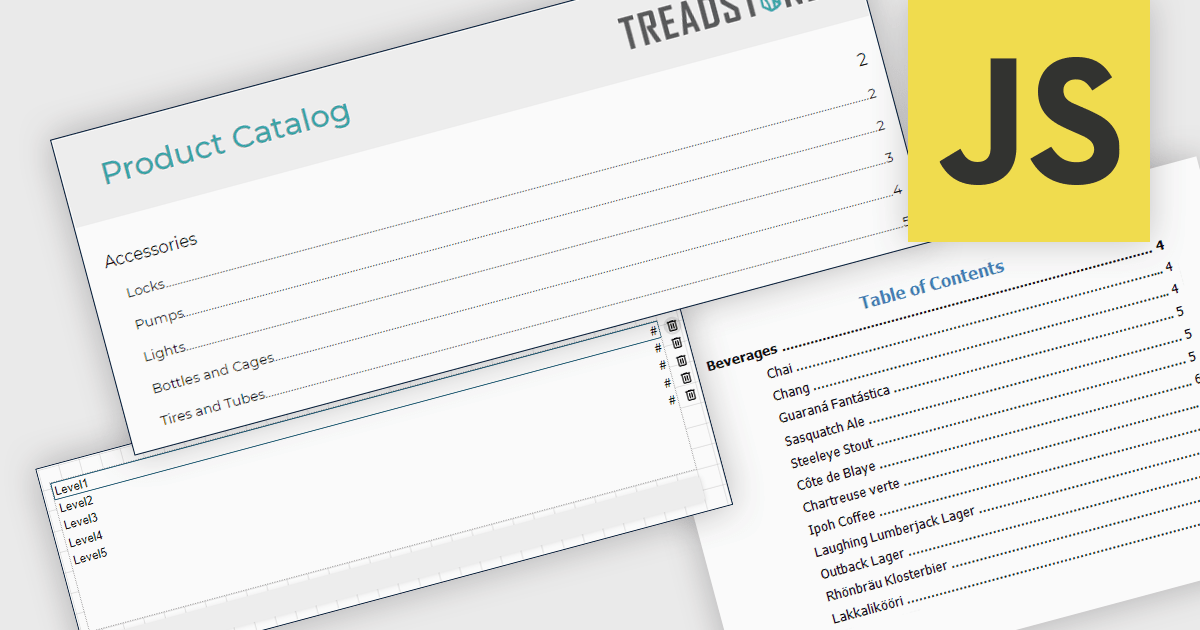
A table of contents in a report is a structured list of sections and subsections that provides an organized overview of the document's content. It typically reflects the report's hierarchy and allows readers to navigate quickly to specific sections, either through page references in printed formats or clickable links in digital formats. This functionality improves usability by reducing the time required to locate information, supporting clearer document structure, and making complex or lengthy reports easier to understand and manage. For organizations that distribute detailed analytical or operational reports, a table of contents contributes to a more professional presentation and a more efficient review process.
Several JavaScript reporting components allow you to add a table of contents, including:
For an in-depth analysis of features and price, visit our comparison of JavaScript reporting components.
電話: (888) 850 9911
Fax: +1 770 250 6199


