


公式サプライヤー
公式および認定ディストリビューターとして200社以上の開発元から正規ライセンスを直接ご提供いたします。
当社のすべてのブランドをご覧ください。
英語で読み続ける:
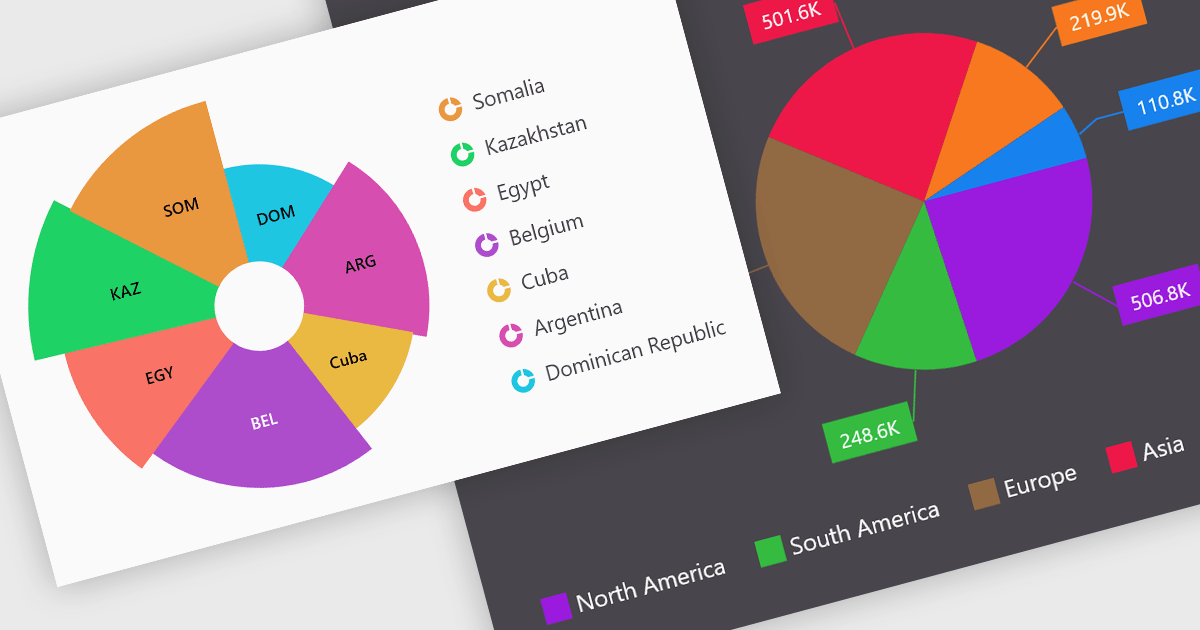
Pie charts are a useful and easily understood tool for visualizing data breakdowns at a glance, particularly when representing percentages of a whole. Their strength lies in highlighting the relative proportions between a small number of categories within a dataset. While less effective for complex comparisons or trends over time, pie charts can be an effective choice to communicate compositions and dominance within a dataset.
Several Blazor Chart controls offer Pie charts including:
For an in-depth analysis of features and price, visit our Blazor Chart controls comparison.
英語で読み続ける:
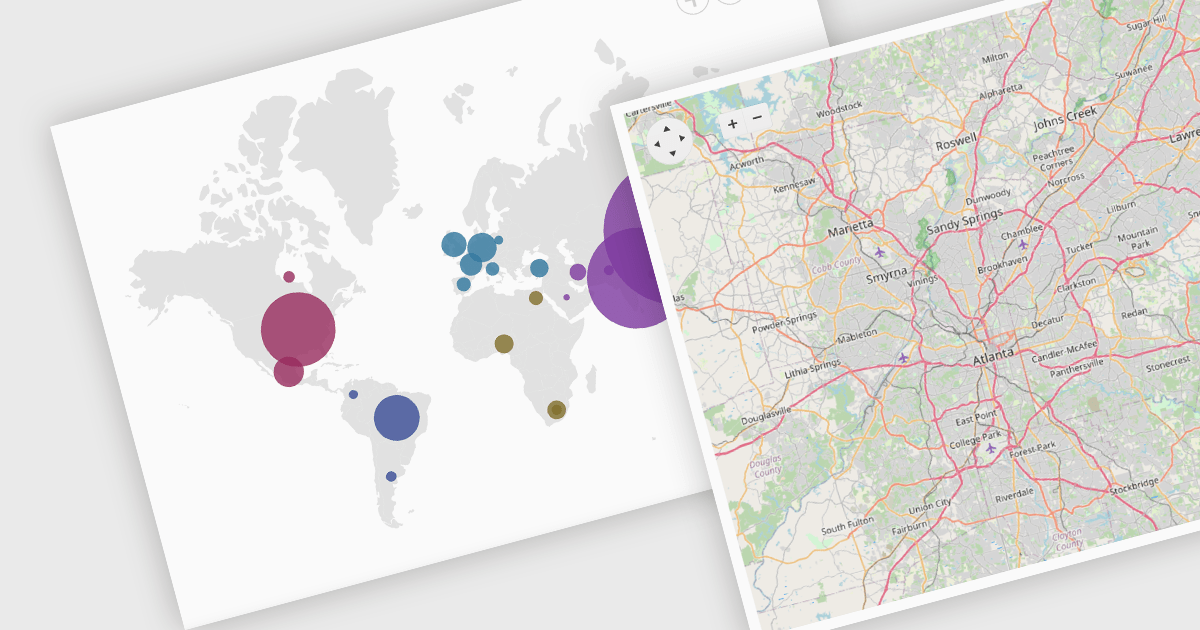
Map component extend your Blazor app's functionality by facilitating the display of geographic information. This allows you to visualize data with real-world location context, enhancing user understanding and engagement. Blazor map components often integrate with popular map providers and support features such as markers, layers, and customization, allowing you to create interactive and informative map experiences within your web application.
Several Blazor UI suites feature map components including:
For an in-depth analysis of features and price, visit our Blazor UI Suites comparison.
英語で読み続ける:
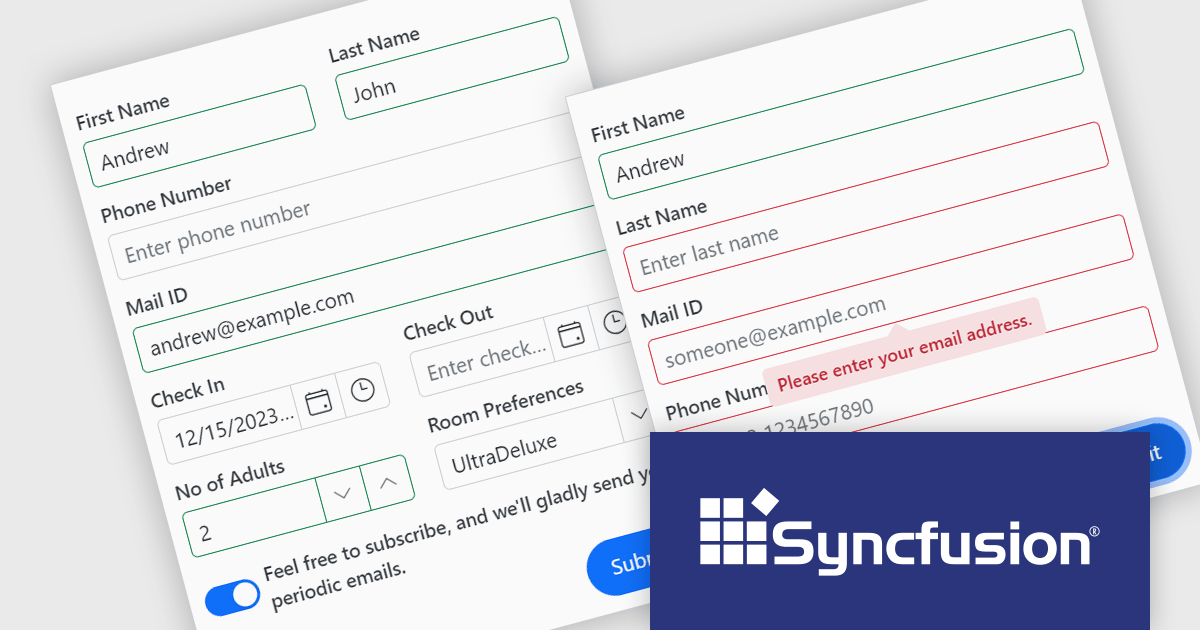
Syncfusion Essential Studio Blazor (available as part of Syncfusion Essential Studio Enterprise) is a comprehensive UI component library designed to accelerate the development of high-performance, modern web applications using the Blazor framework. It boasts over 85+ responsive, lightweight, and modular components spanning various categories such as data visualization, data editing, document processing, and interactive UI elements. This rich repertoire empowers developers to rapidly build user-friendly, feature-rich web interfaces, with seamless integration of both server-side and client-side Blazor applications.
The Syncfusion Essential Studio Blazor Version 2024 Volume 1 (25.1.35) release introduces the production-ready Blazor Data Form component, which is designed to streamline form creation within Blazor applications. It offers features such as automatic field generation based on your data model, seamless data binding for easy integration with your application's logic, and layout customization for a polished user experience. The Blazor Data Form component allows you to build complex or simple forms with minimal coding effort.
To see a full list of what's new in version 2024 Volume 1 (25.1.35), see our release notes.
Syncfusion Essential Studio Blazor is available as part of Syncfusion Essential Studio Enterprise which is licensed per developer starting with a Team License of up to five developers. It is available as a 12 Month Timed Subscription License which includes support and maintenance. See our Syncfusion Essential Studio Enterprise licensing page for full details.
For more information, visit our Syncfusion Essential Studio Blazor product page.
英語で読み続ける:
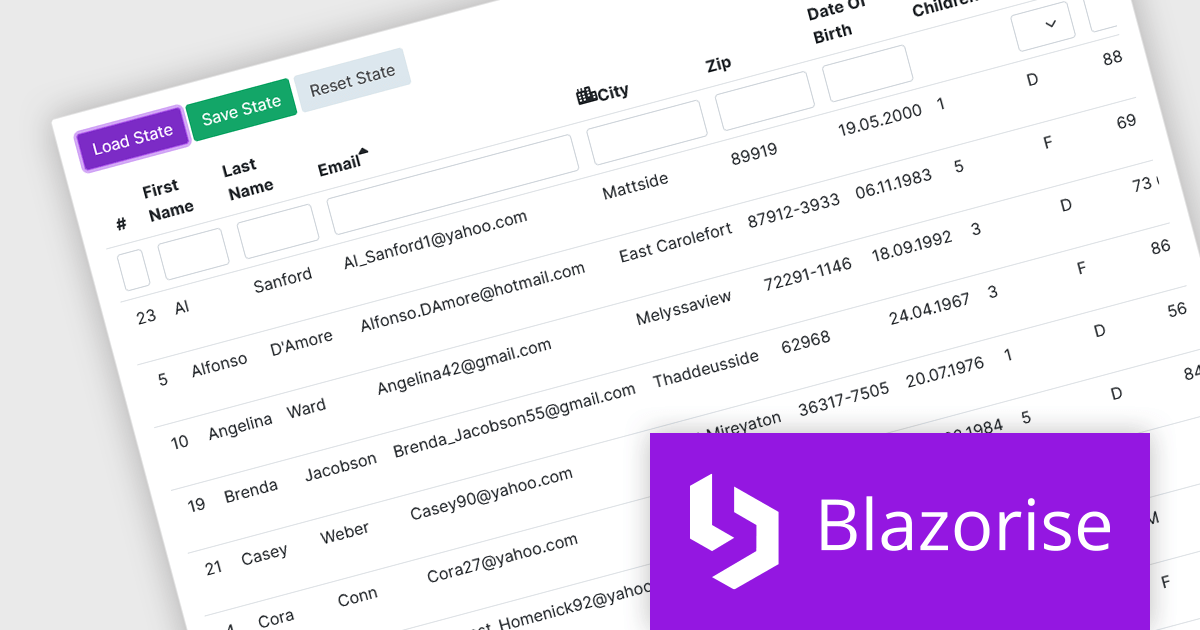
Blazorise is a versatile component library that empowers developers to build modern and feature-rich web applications using Blazor, a client-side web development framework from Microsoft. It offers a comprehensive collection of user interface components, including buttons, forms, tables, charts, and navigation elements, all built with accessibility and responsiveness in mind.
The Blazorise v1.5 update introduces DataGrid State Management. New LoadState and GetState methods enable you to load and save the state of the datagrid from/to LocalStorage. On the first render, the web page checks LocalStorage for saved states and loads them if they are available. This feature enables seamless preservation and restoration of user actions, such as sorting, filtering, and row selections, even when navigating away from or refreshing the page.
To see a full list of what’s new in version 1.5, see our release notes.
Blazorise is licensed per developer and is Runtime Royalty Free. Available in a variety of editions, Professional, Enterprise and Enterprise Plus, each providing different levels of support and services. See our Blazorise licensing page for full details.
For more information, visit our Blazorise product page.

英語で読み続ける:
Infragistics Ignite UI for Blazor is a comprehensive UI component library designed specifically for .NET developers building modern web applications with Blazor. It offers a rich set of over 60 components, including performant data grids, interactive charts, and essential UI elements. This allows developers to craft visually appealing, feature-packed Blazor applications with a focus on data visualization, user interaction, and a variety of design themes.
Version 23.2.189 introduces the new hierarchical data grid. This intuitive component empowers you to present multi-level information in a clear, structured format. Bind your data with minimal coding, and leverage fine-grained control through various events. The grid boasts a rich feature set, including selection tools, advanced filtering and sorting options, all designed to enhance user experience by providing a more organized and interactive way to explore information.
To see a full list of what's new in version 23.2.189, see our release notes.
Infragistics Ignite UI for Blazor is part of Infragistics Ignite UI which is licensed per developer and is available as a Perpetual License with a 1, 2 or 3 year support and maintenance subscription. See our Infragistics Ignite UI licensing page for full details.
Infragistics Ignite UI for Blazor is available in the following products:
電話: (888) 850 9911
Fax: +1 770 250 6199


