


公式サプライヤー
公式および認定ディストリビューターとして200社以上の開発元から正規ライセンスを直接ご提供いたします。
当社のすべてのブランドをご覧ください。
英語で読み続ける:
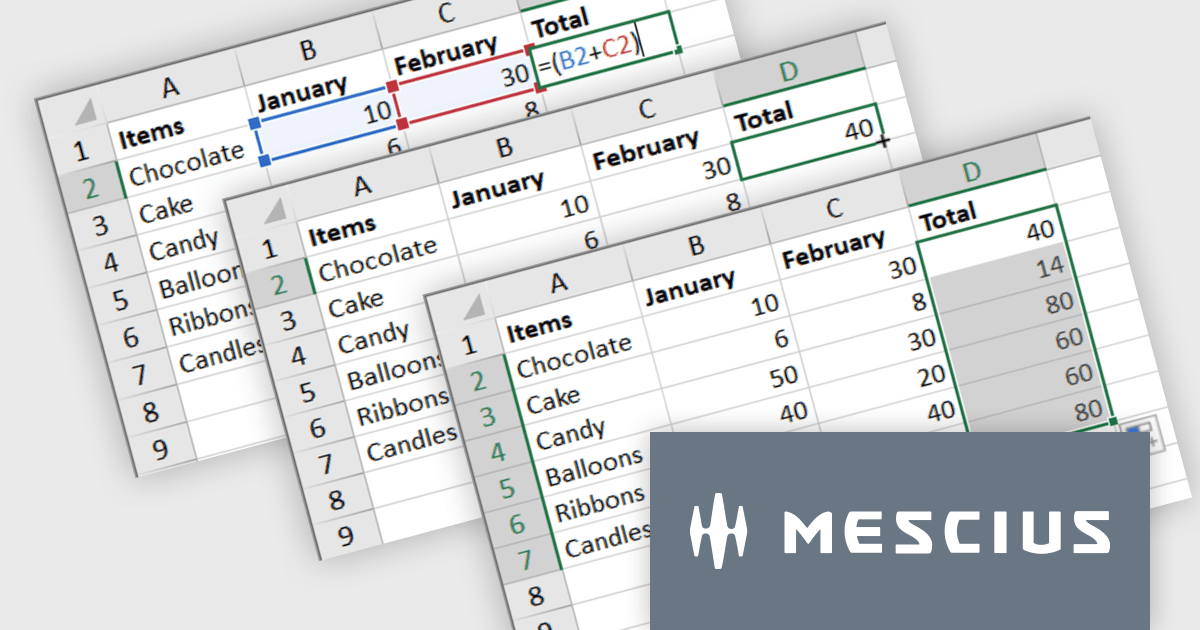
Spread.NET by MESCIUS helps you create spreadsheets, grids, dashboards, and forms. It includes a powerful calculation engine with 450+ functions and the ability to import and export Microsoft Excel spreadsheets. Developers can leverage the extensive .NET spreadsheet API and powerful calculation engine to create analysis, budgeting, dashboard, data collection and management, scientific, and financial applications.
The Spread.NET v17.1 update introduces a streamlined method for extending formulas across datasets by allowing users to double-click the fill handle located at the bottom right corner of a selected cell. This action automatically replicates the formula down to the end of the data range, aligning it with the rows in adjacent columns. By simplifying the process of copying formulas, this feature enhances both efficiency and accuracy in data management tasks. It eliminates the need for manual drag-and-fill operations, reducing the time spent on repetitive tasks and minimizing the risk of inconsistencies in data entry. This improvement is particularly advantageous for users working with extensive datasets, facilitating quicker data processing and a more user-friendly experience in spreadsheet management.
To see a full list of what's new in version 17.1, see our release notes.
Spread.NET is licensed per developer and is available as a Perpetual License with a 12 month support and maintenance subscription. We can supply any Spread.NET license including new licenses, maintenance renewals, and upgrade licenses. See our Spread.NET licensing page for full details.
For more information, visit our Spread.NET product page.
英語で読み続ける:
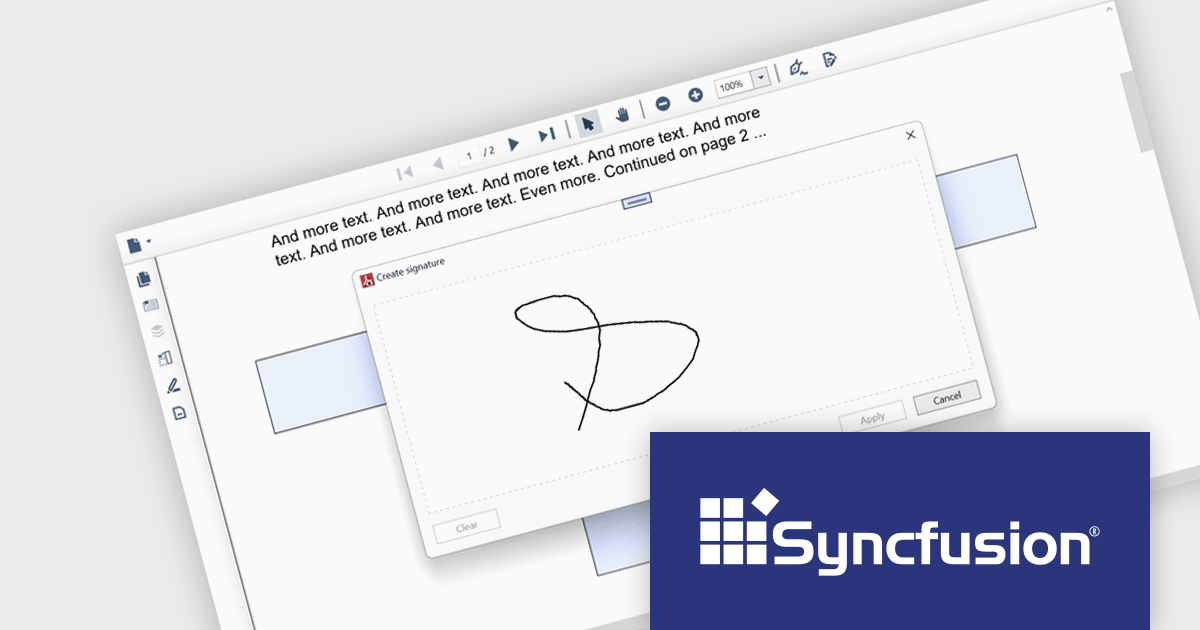
Syncfusion Essential Studio WPF, available as part of Syncfusion Essential Studio Enterprise, is a powerful suite of over 95 UI controls, 50+ charts, and document processing libraries designed to boost the development of high-performance line-of-business applications for the Windows Presentation Foundation (WPF) framework. With built-in themes, touch-friendly interfaces, and seamless Visual Studio integration, it empowers developers to craft modern, feature-rich, and cross-platform experiences with ease.
The Syncfusion Essential Studio WPF 2024 Volume 1 (25.1.35) release adds support for signature form fields in the PDF Viewer component. This empowers users to effortlessly view, add, or remove signatures directly within PDFs, eliminating the need for physical printing and scanning, thereby saving time and improving efficiency. The addition of signature form fields ensures a clear audit trail, fostering trust and accountability in collaborative environments.
To see a full list of what's new in version 2024 Volume 1 (25.1.35), see our release notes.
Syncfusion Essential Studio WPF is available as part of Syncfusion Essential Studio Enterprise which is licensed per developer starting with a Team License of up to five developers. It is available as a 12 Month Timed Subscription License which includes support and maintenance. See our Syncfusion Essential Studio Enterprise licensing page for full details.
For more information, visit our Syncfusion Essential Studio WPF product page.
英語で読み続ける:
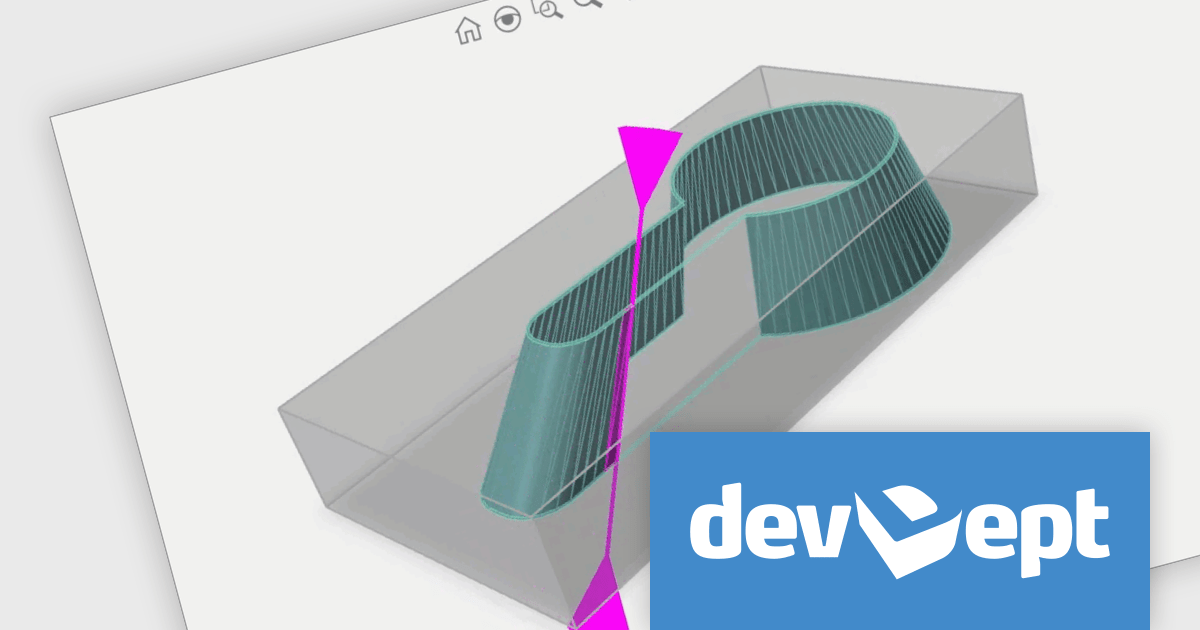
Eyeshot by devDept Software empowers you to integrate robust CAD functionalities into your .NET applications. Supporting both Windows Forms and WPF natively, it offers a comprehensive suite of tools accessible through the Visual Studio toolbox. These include Design for 2D/3D geometry creation and editing, Drawing for automatic 2D view generation, Simulation for geometry validation, and Manufacture for CNC toolpath generation and simulation.
The Eyeshot 2024 release introduces MultiFastMesh, a solution specifically designed to address a prevalent challenge in CAD applications - visualizing complex 3D objects comprised of numerous sub-parts. Traditionally, merging these sub-parts into a single mesh enhances performance but eliminates control over individual sub-mesh visibility and color. MultiFastMesh bridges this gap, offering the combined benefits of efficient single-mesh rendering and the flexibility of maintaining control over individual sub-meshes.
To see a full list of what's new in version 2024, see our release notes.
Eyeshot is licensed per developer and is available as an annual license, with either Lite or Priority support. See our licensing pages for Eyeshot Pro, Eyeshot Ultimate, and Eyeshot Fem for full details.
Eyeshot is available to buy in the following products:
英語で読み続ける:
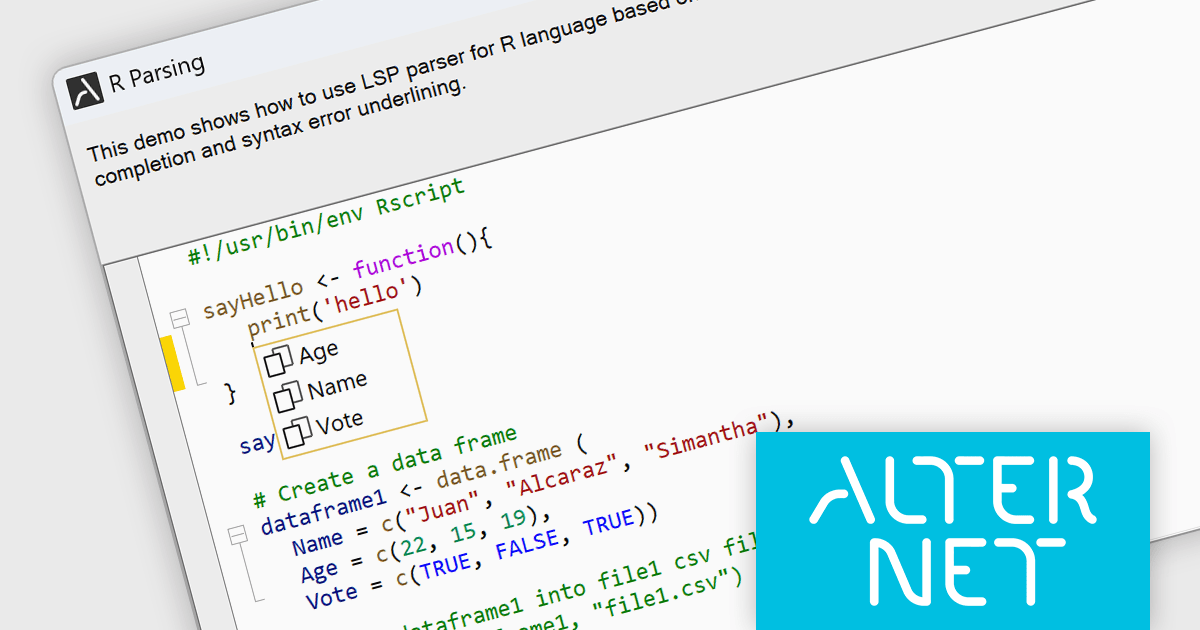
AlterNET Studio is a development toolkit designed specifically for .NET developers building Windows Forms or WPF applications. It provides a suite of components that integrate seamlessly into your applications, offering functionalities like advanced code editing with features akin to Microsoft Visual Studio, scripting capabilities in various languages for extending application logic, and a visual form designer for crafting user interfaces.
The AlterNET Studio v9.5.2 update brings a significant improvement for developers working with C/C++, Java, Lua, PowerShell, and R code with the introduction of smart indentation support for their respective LSP parsers. This new feature ensures that indentation is automatically adjusted based on the code structure, enhancing readability and maintainability. By automating indentation, developers can focus on writing logic and functionality rather than manually managing indentation levels, which can be especially time-consuming and error-prone in complex codebases.
To see a full list of what's new in v9.5.2, see our release notes.
AlterNET Studio is licensed per developer. A license is only required when developing and compiling applications that use AlterNET Studio; end-users or testers of compiled applications do not require a license. The perpetual license includes a one-year subscription which entitles you to free updates to all new versions during the subscription period. See our AlterNET Studio licensing page for full details.
Learn more on our AlterNET Studio product page.
英語で読み続ける:
XFINIUM.PDF CROSS-PLATFORM BUNDLE is a software library that allows developers to create applications that can work with PDF files on a variety of platforms, including Windows, Mac, mobile devices (iOS and Android), and web applications. This means developers can write code once and deploy their PDF functionality across different environments without needing to rewrite for each platform.
The XFINIUM.PDF CROSS-PLATFORM BUNDLE V13.0 release adds support for multi-threaded PDF to image conversion. By utilizing multiple threads, the software can convert PDF files to images much faster compared to single-threaded processing. This can be especially advantageous when converting large or complex PDFs.
To see a full list of what's new in version 13.0.0, see our release notes.
XFINIUM.PDF CROSS-PLATFORM BUNDLE is licensed per developer and is run-time royalty free. All licenses include a 12 month subscription which provides all major and minor product updates and technical support. See our XFINIUM.PDF CROSS-PLATFORM BUNDLE licensing page for full details.
For more information, visit our XFINIUM.PDF CROSS-PLATFORM BUNDLE product page.
電話: (888) 850 9911
Fax: +1 770 250 6199


