jQuery を使用したチャートの注釈付け

8月 10, 2023
重要なデータポイントと傾向を注釈で強調表示することで、グラフの分かりやすさを向上

英語で読み続ける:

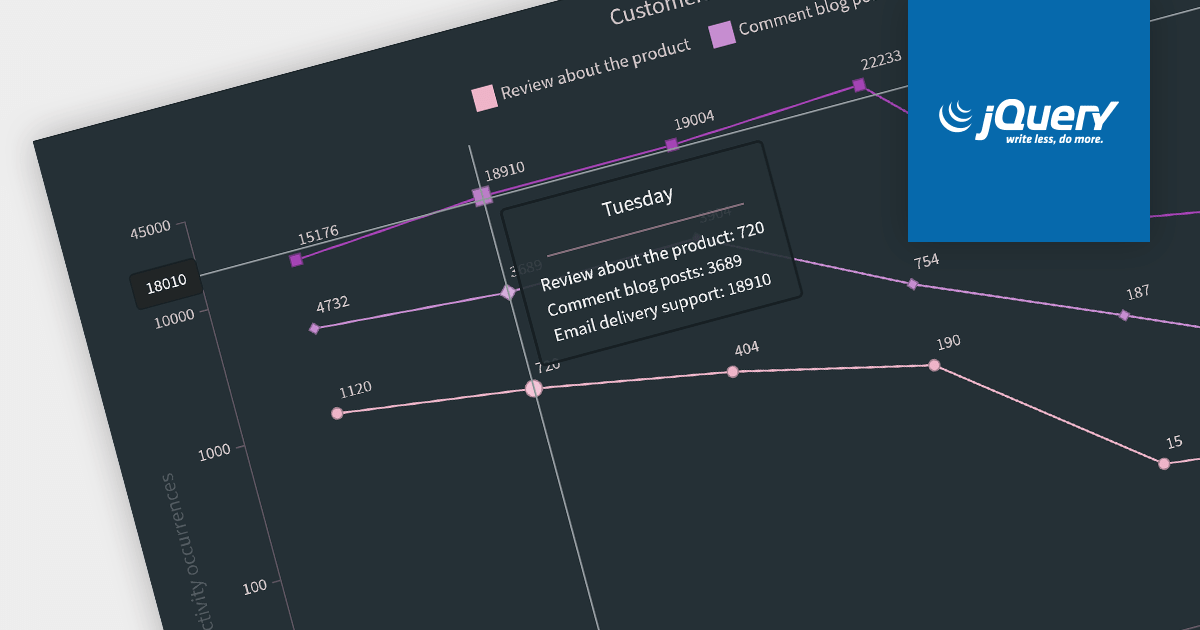
Chart annotation involves adding labels, markers, or other visual cues to data points on a chart. It enhances data visualization, providing context and insights to users, improving chart readability, and conveying information effectively.

Here is a selection of individual jQuery chart components that offer the ability to add annotations:

  • Highcharts Core (by Highsoft) allows you to create interactive charts by seamlessly incorporating annotations. Highlight key data points, create callouts, and draw shapes and lines to enhance your visualizations.
  • TeeChart JS (by Steema Software) offers versatile and extensive annotation support. Add context to your charts through text, images, custom HTML, and shapes, enhancing data interpretation.
  • AnyChart JS allows you to elevate your charts with a rich array of annotations. Emphasize trends using text, images, shapes, lines, and arrows, making your data-driven insights more impactful and interactive.
  • ZingChart provides various annotation options. From text and images to shapes and lines, annotations add depth to your visualizations, improving communication of insights.

Many multi-function component suites provide charting components with annotation support, including:

  • DevExtreme Chart (part of DevExtreme Complete by DevExpress) allows you to add annotations to charts that can be animated and interactive. Enrich your charts with text, images, shapes, and lines for dynamic data visualization.
  • Ignite UI jQuery Chart (part of Ignite UI by Infragistics) allows you to seamlessly incorporate annotations into your charts. Add text, images, shapes, and lines to communicate key insights, making your visualizations more engaging and informative.
  • Kendo UI for jQuery Chart (part of Kendo UI by Telerik) allows you to harness extensive customization options, including animated and interactive annotations. Enhance your charts with text, images, shapes, and lines, delivering data-driven insights effectively.
  • Syncfusion JavaScript Chart (part of Syncfusion Essential Studio Enterprise) offers versatile annotation features, such as customizable text, images, shapes, and lines.

For an in-depth analysis of features and price, visit our comparison of jQuery charts.

Compare jQuery Charts