


公式サプライヤー
公式および認定ディストリビューターとして200社以上の開発元から正規ライセンスを直接ご提供いたします。
当社のすべてのブランドをご覧ください。
英語で読み続ける:
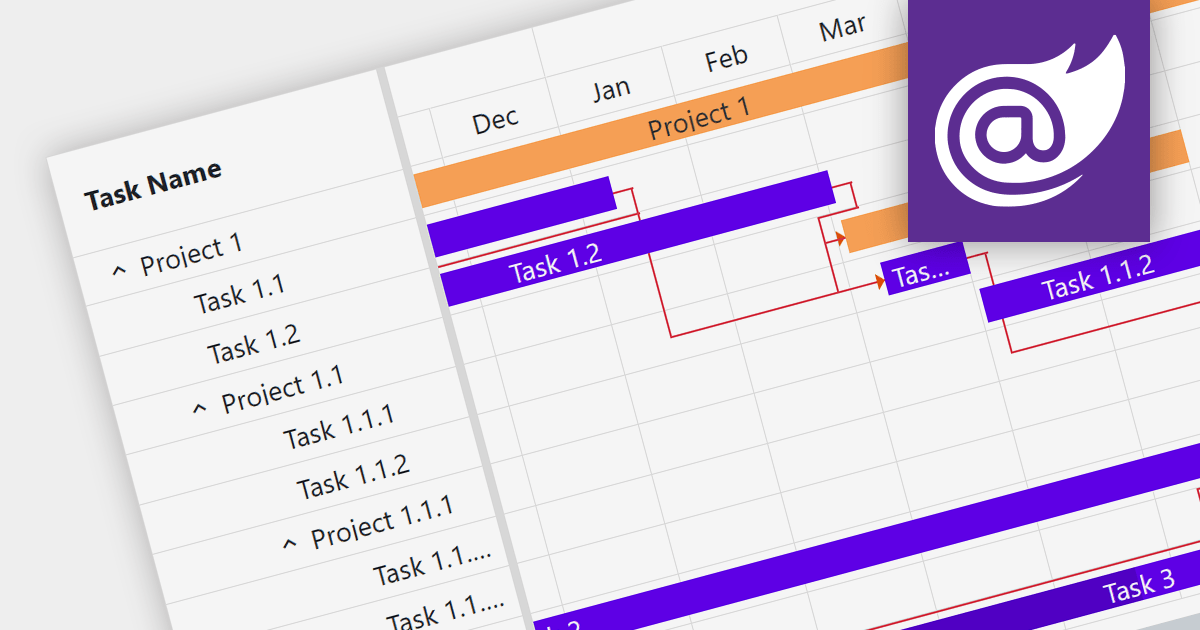
Gantt charts are a type of bar chart designed to illustrate project schedules. They display the start and end dates of different elements of a project and are essential for project management. These charts are useful for tracking project progress and for planning by showing how project tasks overlap and relate to each other.
Several Blazor chart components provide Gantt charts including:
For an in-depth analysis of features and price, visit our Blazor Charts comparison.
電話: (888) 850 9911
Fax: +1 770 250 6199


