


公式サプライヤー
公式および認定ディストリビューターとして200社以上の開発元から正規ライセンスを直接ご提供いたします。
当社のすべてのブランドをご覧ください。
英語で読み続ける:
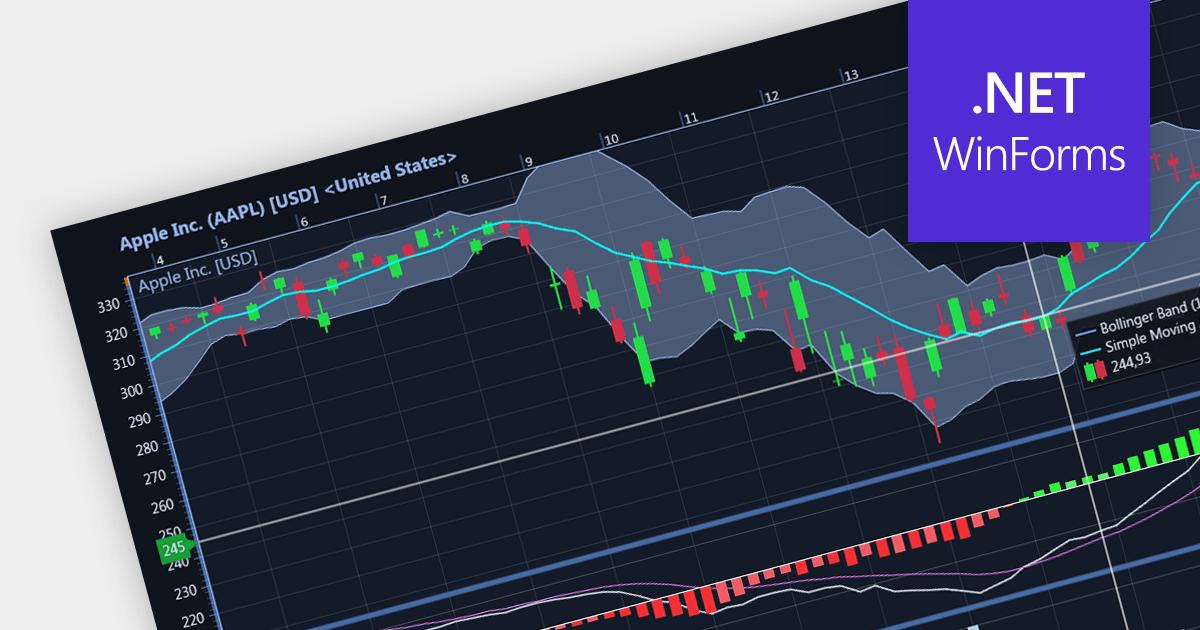
Candlestick charts are a style of financial chart used to describe price movements of a security, derivative, or currency. Each "candlestick" typically shows one day, with the central "box" representing the range between the opening and closing prices and the lines showing highs and lows. Their unique visual format helps traders to quickly understand market sentiment.
Several WinForms chart controls offer Candlestick charts including:
For an in-depth analysis of features and price, visit our WinForms chart controls comparison.
電話: (888) 850 9911
Fax: +1 770 250 6199


