


公式サプライヤー
公式および認定ディストリビューターとして200社以上の開発元から正規ライセンスを直接ご提供いたします。
当社のすべてのブランドをご覧ください。
英語で読み続ける:
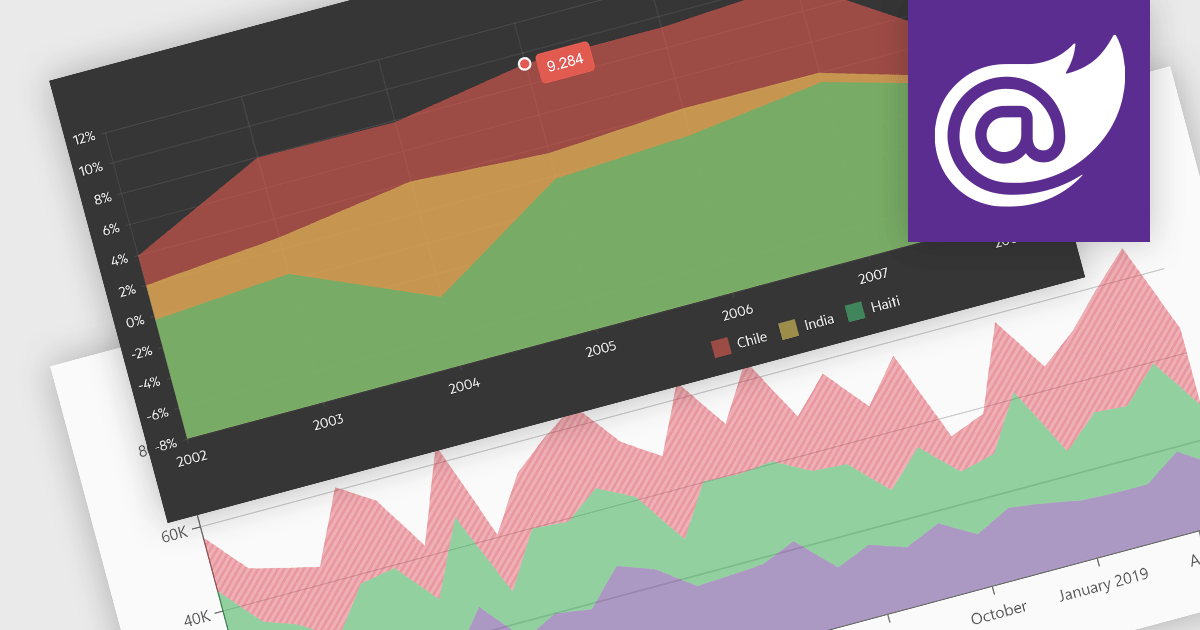
Area charts combine the strengths of line and bar charts, typically depicting how quantitative data changes over time. The area beneath the lines is shaded, emphasizing trends, comparisons between multiple data series, and the magnitude of change within each series. Ideal for showcasing cumulative totals and proportions, area charts excel in revealing trends and relationships within your data.
Several Blazor chart controls offer area charts including:
For an in-depth analysis of features and price, visit our Blazor chart controls comparison.
電話: (888) 850 9911
Fax: +1 770 250 6199


