


公式サプライヤー
公式および認定ディストリビューターとして200社以上の開発元から正規ライセンスを直接ご提供いたします。
当社のすべてのブランドをご覧ください。
英語で読み続ける:
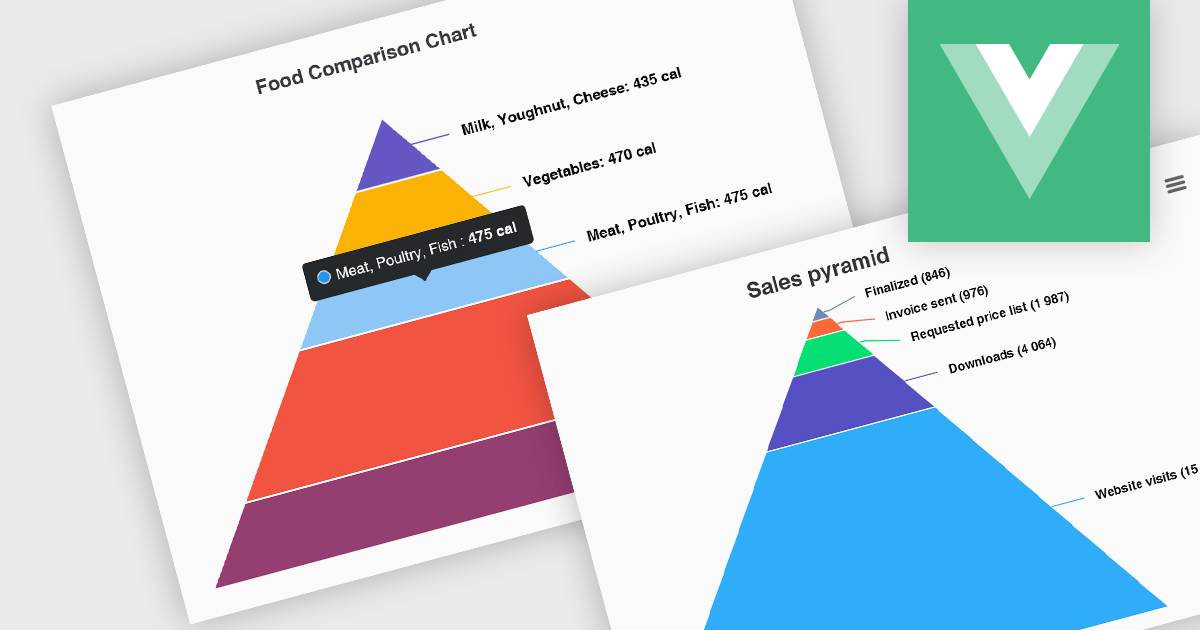
Pyramid charts, also known as triangle diagrams, utilize a triangular shape segmented into horizontal sections, each representing a level in a hierarchy, process, or simple dataset. Their strength lies in visually depicting hierarchical relationships, emphasizing the relative importance or size of each level through varying widths. The easily understood layout makes them ideal for communicating clear, singular data points in fields like sales funnels, population structures, and educational concepts.
Several Vue.js chart controls offer pyramid charts including:
For an in-depth analysis of features and price, visit our Vue.js chart controls comparison.
電話: (888) 850 9911
Fax: +1 770 250 6199


