


公式サプライヤー
公式および認定ディストリビューターとして200社以上の開発元から正規ライセンスを直接ご提供いたします。
当社のすべてのブランドをご覧ください。
英語で読み続ける:
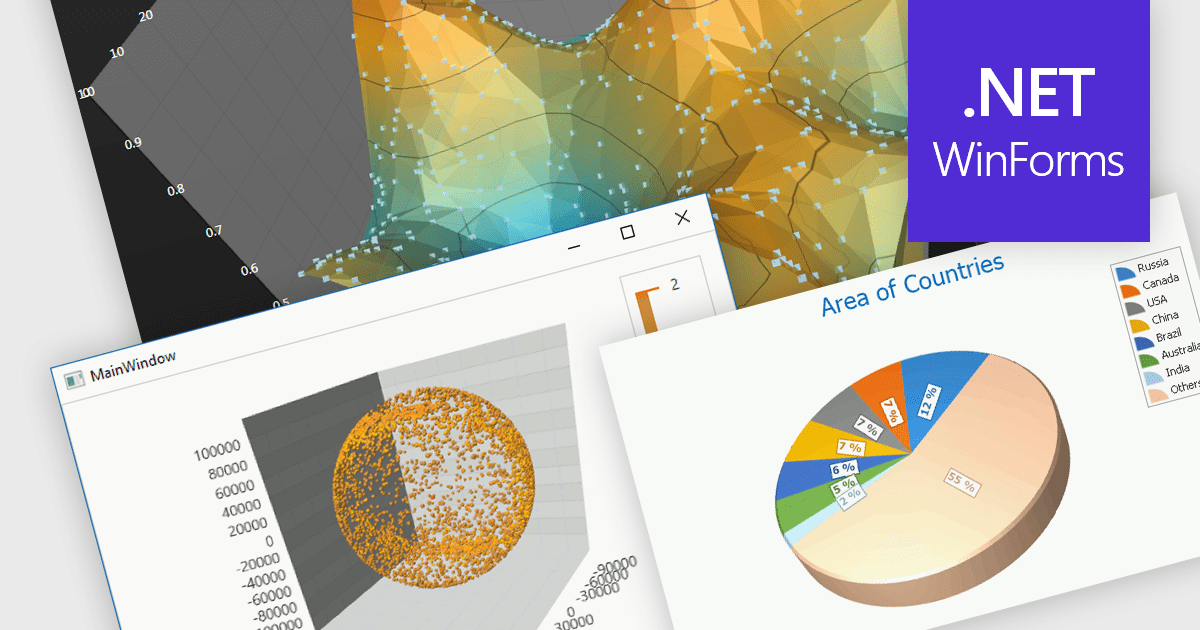
3D charts excel at showcasing complex datasets with three variables. By adding depth, they allow viewers to grasp intricate relationships between these variables that might be difficult to decipher in a flat, 2D format. This enhanced visualization can reveal patterns and trends that would otherwise remain hidden, leading to a deeper understanding of the data.
Several WinForms Chart controls offer 3D charts including:
For an in-depth analysis of features and price, visit our WinForms Chart controls comparison.
電話: (888) 850 9911
Fax: +1 770 250 6199


