


公式サプライヤー
公式および認定ディストリビューターとして200社以上の開発元から正規ライセンスを直接ご提供いたします。
当社のすべてのブランドをご覧ください。
英語で読み続ける:
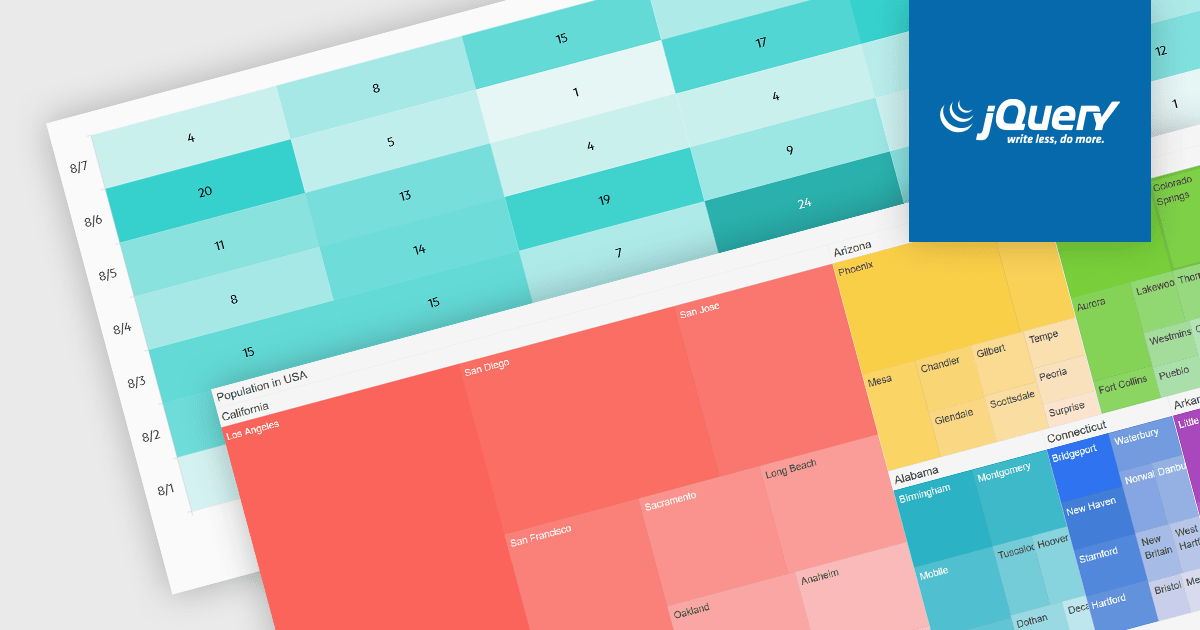
Heatmaps and treemaps are powerful data visualization tools that offer specific advantages when examining large datasets. A heatmap colorizes data values in a matrix, allowing for intuitive observation of trends, patterns, and outliers over two dimensions, making it helpful for spatial data analysis and correlation assessment. Treemaps exhibit hierarchical data as nested rectangles, with size and color variations indicating distinct quantitative values, allowing for effective use of space and fast comparison of proportions and relationships within hierarchical structures. Together, these chart types provide significant tools for visualizing and interpreting complex data, improving decision-making processes by presenting underlying data insights in a clear and actionable manner.
Several jQuery chart controls support the Heat and Treemap chart types, including:
For an in-depth analysis of features and price, visit our comparison of jQuery chart controls.
電話: (888) 850 9911
Fax: +1 770 250 6199


