


公式サプライヤー
公式および認定ディストリビューターとして200社以上の開発元から正規ライセンスを直接ご提供いたします。
当社のすべてのブランドをご覧ください。
英語で読み続ける:
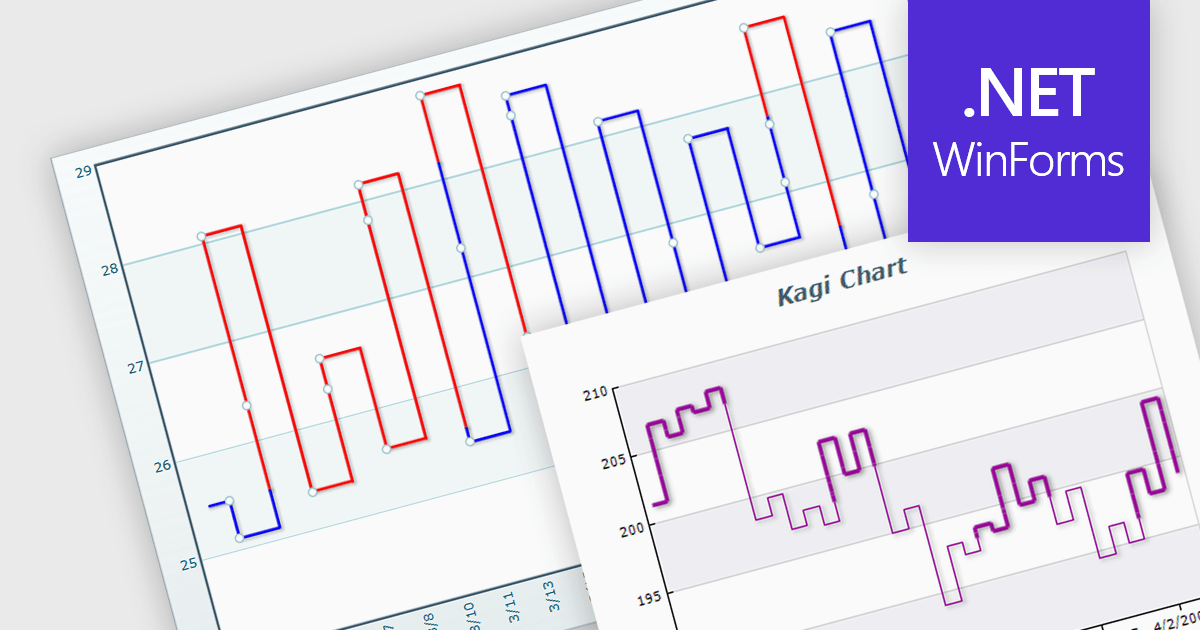
A Kagi chart is a type of financial chart used to track price movements, with a focus on significant trends and reversals rather than minor fluctuations, to inform stock purchasing decisions. It features a series of vertical lines that reflect changes in price. The direction of these lines shifts only when the price moves by a predetermined amount, known as the reversal amount. Thin lines indicate that the price has fallen below the previous low while thick lines indicate that the price has surpassed the previous high. By filtering out minor price fluctuations it emphasises substantial price movements, offering a clearer perspective on market trends.
Several WinForms chart components provide Kagi charts, including:
For an in-depth analysis of features and price, visit our WinForms charts comparison.
電話: (888) 850 9911
Fax: +1 770 250 6199


