


公式サプライヤー
公式および認定ディストリビューターとして200社以上の開発元から正規ライセンスを直接ご提供いたします。
当社のすべてのブランドをご覧ください。
英語で読み続ける:
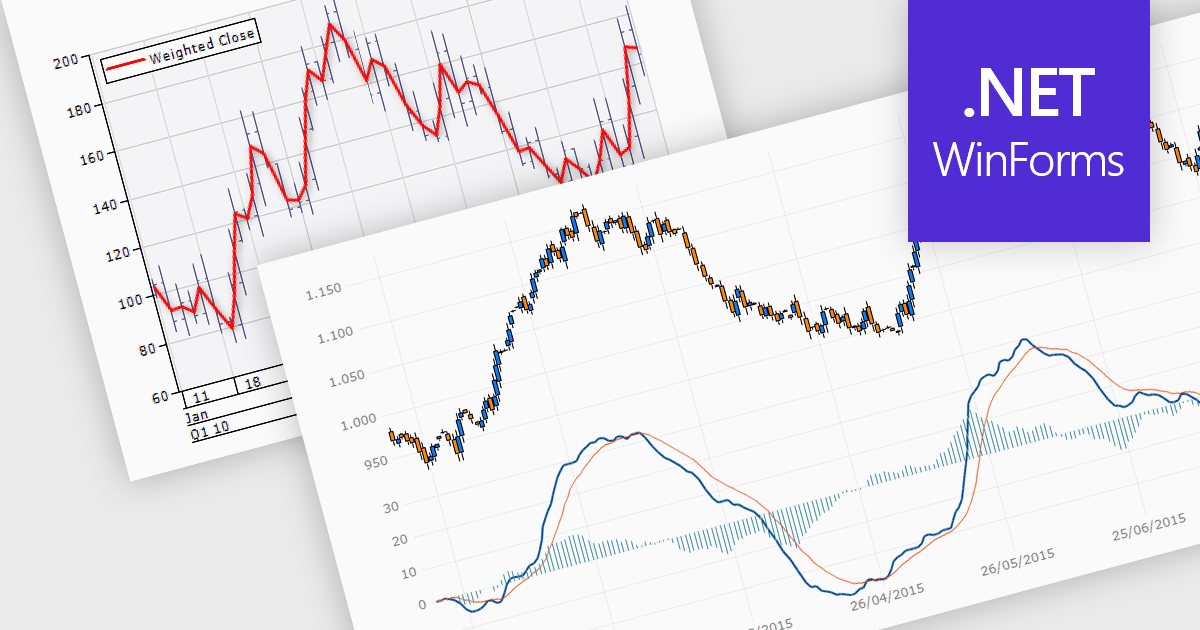
Trend lines are essential tools in data visualization and financial analysis, used to identify and interpret the direction and strength of trends in data sets. A trend line is a line that best represents the data on a chart, highlighting the general direction over a specified period. This is beneficial for making informed decisions, predicting future price movements, and validating the strength of ongoing trends. In stock market analysis, a trend line can help investors determine optimal entry and exit points, while moving averages can signal buy or sell opportunities, enhancing the effectiveness of trading strategies.
Several .NET WinForms chart controls offer trend lines and indicators including:
For an in-depth analysis of features and price, visit our comparison of .NET WinForms chart controls.
電話: (888) 850 9911
Fax: +1 770 250 6199


