


公式サプライヤー
公式および認定ディストリビューターとして200社以上の開発元から正規ライセンスを直接ご提供いたします。
当社のすべてのブランドをご覧ください。
英語で読み続ける:
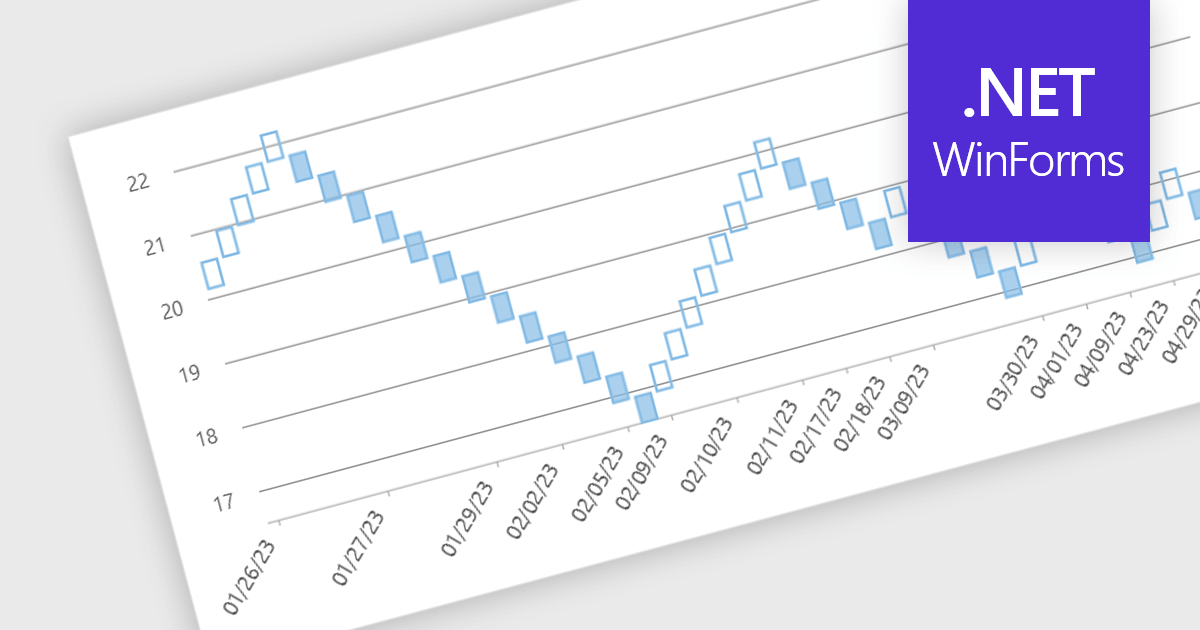
Renko charts are specialized financial charts that represent price movements with fixed-sized bricks, filtering out minor price fluctuations to highlight significant trends. These charts are particularly useful for identifying key support and resistance levels, making trend direction clearer by eliminating noise from the data. A primary benefit of Renko charts lies in their ability to simplify the visualization of market trends and price patterns, aiding developers in creating sophisticated financial applications that require precise and clear representation of market behavior. By using Renko charts, developers can enhance the analytical capabilities of their applications, providing users with powerful tools to make informed trading decisions.
Several .NET WinForms Chart controls offer a Renko chart including:
For an in-depth analysis of features and price, visit our comparison of .NET WinForms Chart controls.
電話: (888) 850 9911
Fax: +1 770 250 6199


