


公式サプライヤー
公式および認定ディストリビューターとして200社以上の開発元から正規ライセンスを直接ご提供いたします。
当社のすべてのブランドをご覧ください。
英語で読み続ける:
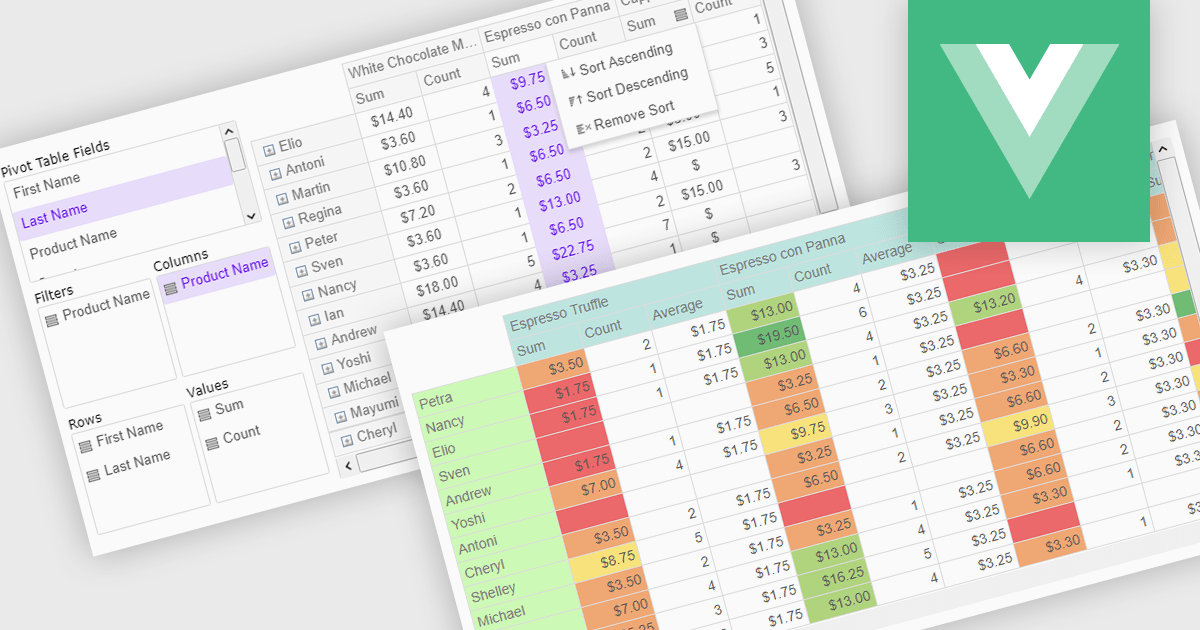
Pivot grids or tables are dynamic tools that allow users to organize and analyze large datasets interactively by allowing them to group, filter, and summarize data across multiple dimensions. This functionality makes it easier to spot patterns and insights, supporting faster decision-making and data processing. Common use cases include help to identify trends in product performance or customer demographics, or financial applications, where users can analyze and forecast expense patterns. Pivot grids empower users with an adaptable and user-friendly interface, offering both high-level overviews and detailed insights with minimal effort.
Several Vue.js UI suites offer pivot grid components including:
For an in-depth analysis of features and price, visit our comparison of Vue.js UI suites.
電話: (888) 850 9911
Fax: +1 770 250 6199


