


公式サプライヤー
公式および認定ディストリビューターとして200社以上の開発元から正規ライセンスを直接ご提供いたします。
当社のすべてのブランドをご覧ください。
英語で読み続ける:
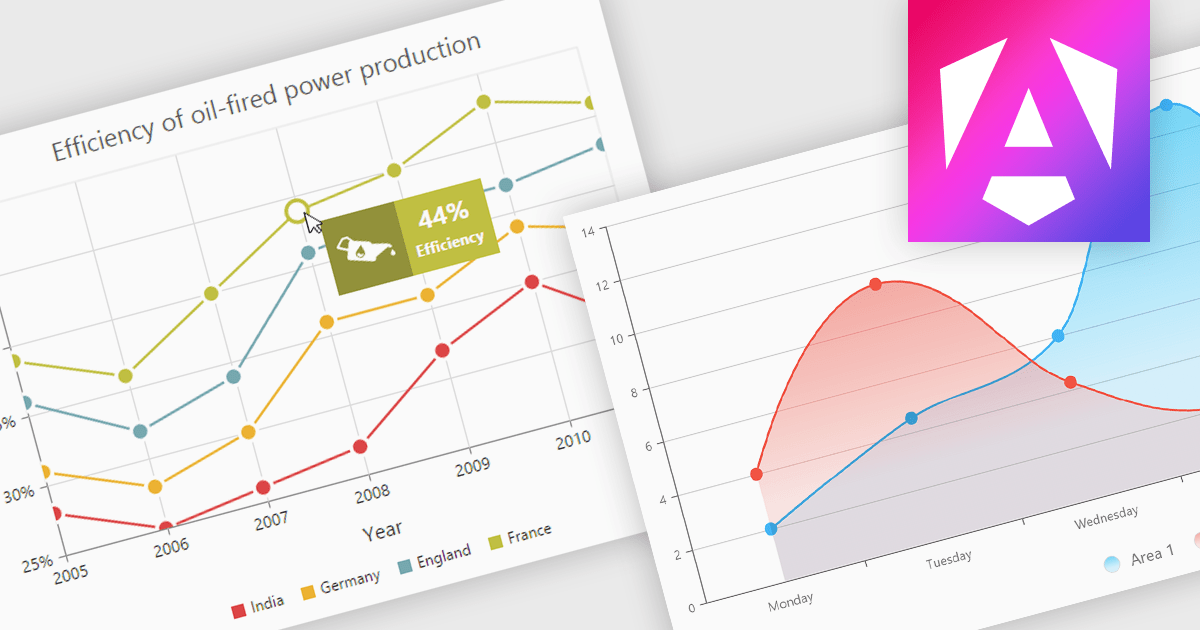
Chart tooltips provide interactive, on-demand insights by displaying detailed information about specific data points when users hover or click on them. They play a crucial role in improving data clarity, enhancing user engagement, and maintaining a clean, uncluttered chart layout. The benefits of tooltips include simplifying the exploration of complex datasets and offering customizable content, such as values, comparisons, or additional context. For example, tooltips can display product sales figures on a business dashboard or detailed stock breakdowns in financial reports. This functionality makes tooltips an indispensable feature for creating intuitive, data-driven applications that empower users to make informed decisions.
Several Angular chart controls offer tooltip support including:
For an in-depth analysis of features and price, visit our Angular chart controls comparison:
電話: (888) 850 9911
Fax: +1 770 250 6199


