


公式サプライヤー
公式および認定ディストリビューターとして200社以上の開発元から正規ライセンスを直接ご提供いたします。
当社のすべてのブランドをご覧ください。
英語で読み続ける:
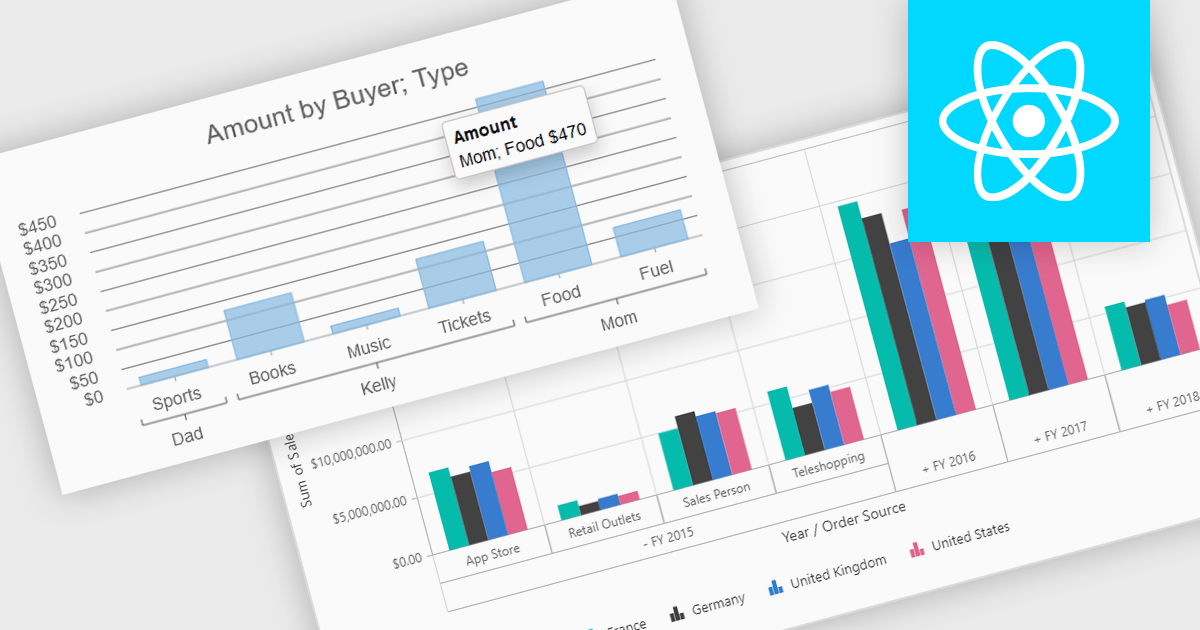
Pivot charts are dynamic visualization tools that enable users to interact with and analyze data in a highly flexible manner. They extend the capabilities of pivot tables by providing visual representations of aggregated data, making it easier to identify trends, patterns, and outliers. Key benefits include real-time updates, intuitive interactivity, and support for multi-dimensional data analysis, which simplifies complex datasets into actionable insights. Integrating pivot charts into your applications empowers end-users to explore and present data in a way that is both visually compelling and deeply informative.
Several React UI suites offer pivot chart components including:
For an in-depth analysis of features and price, visit our comparison of React UI Suites.
電話: (888) 850 9911
Fax: +1 770 250 6199


