公式サプライヤー
公式および認定ディストリビューターとして200社以上の開発元から正規ライセンスを直接ご提供いたします。
当社のすべてのブランドをご覧ください。

英語で読み続ける:
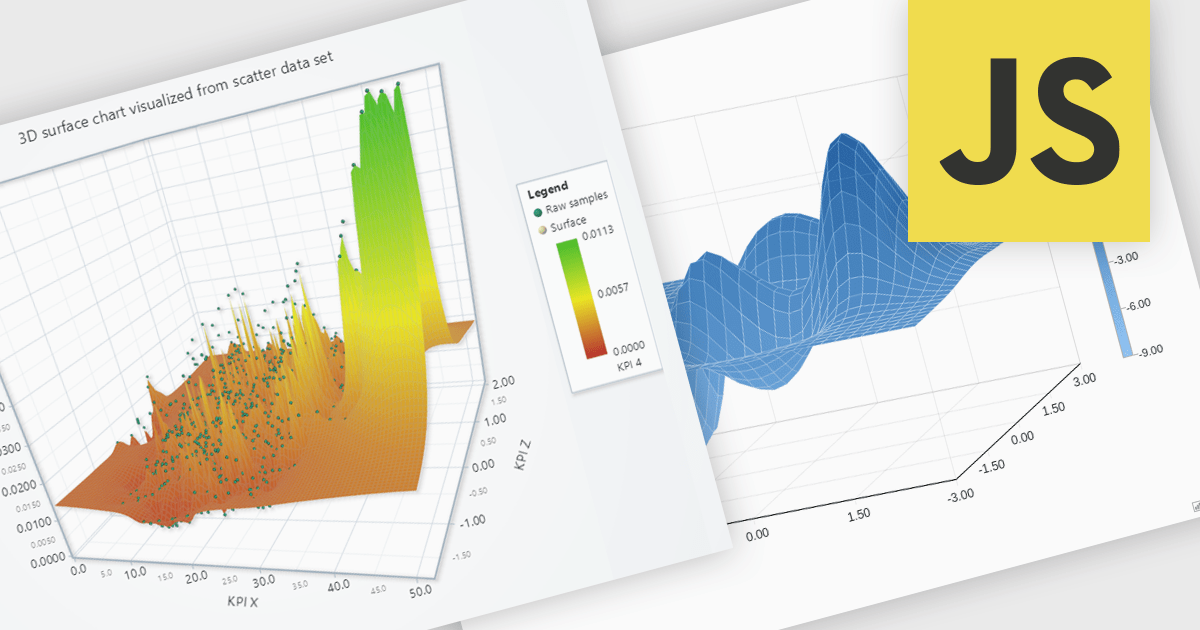
Surface charts are 3D visualizations that show relationships between three numerical variables as a continuous surface. They help identify trends and optimal values, making them useful in science, engineering, and business. Common uses include topographical mapping, financial modeling, and performance analysis. For example, businesses can use surface charts to analyze how price and demand affect revenue, helping them find the best price point. By displaying data in three dimensions, surface charts reveal insights that may not be clear in 2D charts.
Several JavaScript chart controls offer support for Surface charts, including:
For an in-depth analysis of features and price, visit our JavaScript chart controls comparison.