公式サプライヤー
公式および認定ディストリビューターとして200社以上の開発元から正規ライセンスを直接ご提供いたします。
当社のすべてのブランドをご覧ください。

英語で読み続ける:
Xceed Workbooks for .NET is a software component designed for .NET developers that enables the creation and manipulation of Microsoft Excel .xlsx files directly within their applications, without requiring Microsoft Excel or Office to be installed; it provides an API that allows for programmatic control over spreadsheet content, formatting, and structure, facilitating tasks such as report generation, data analysis, and document automation.
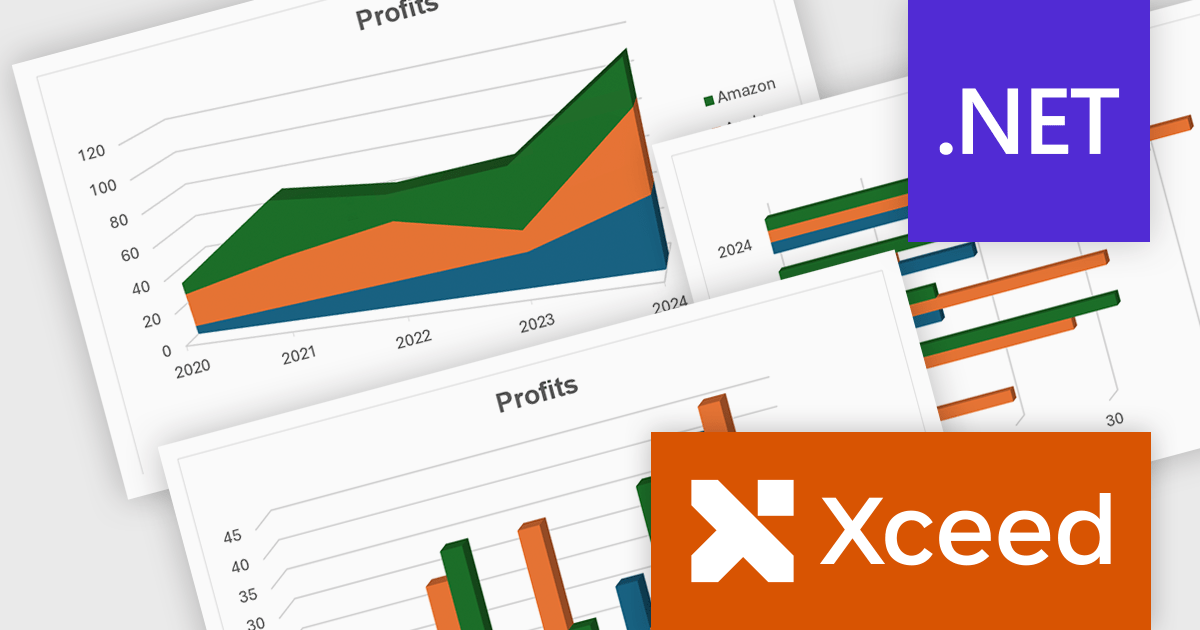
The Xceed Workbooks for .NET V3.0 release significantly enhances charting capabilities by allowing developers to programmatically create and manage a wide range of chart types without relying on external tools. From standard line, column, bar, pie, and doughnut charts to more advanced options like scatter, bubble, radar, and stock charts, the update ensures broad coverage of data visualization needs. Notably, the version also brings in new 3D chart types such as Surface3D and Contour3D, offering more depth and interactivity for technical and scientific data presentation. This expanded support empowers users to deliver polished, professional-grade reports and dashboards within their .NET environments.
To see a full list of what's new in V3.0, see our release notes.
Xceed Workbooks for .NET is licensed per developer and is available as a perpetual license with 1 year of updates and support. See our Xceed Workbooks for .NET licensing page for full details.
Xceed Workbooks for .NET is available individually or as part of Xceed Ultimate Suite.