













公式サプライヤー
公式および認定ディストリビューターとして200社以上の開発元から正規ライセンスを直接ご提供いたします。
当社のすべてのブランドをご覧ください。
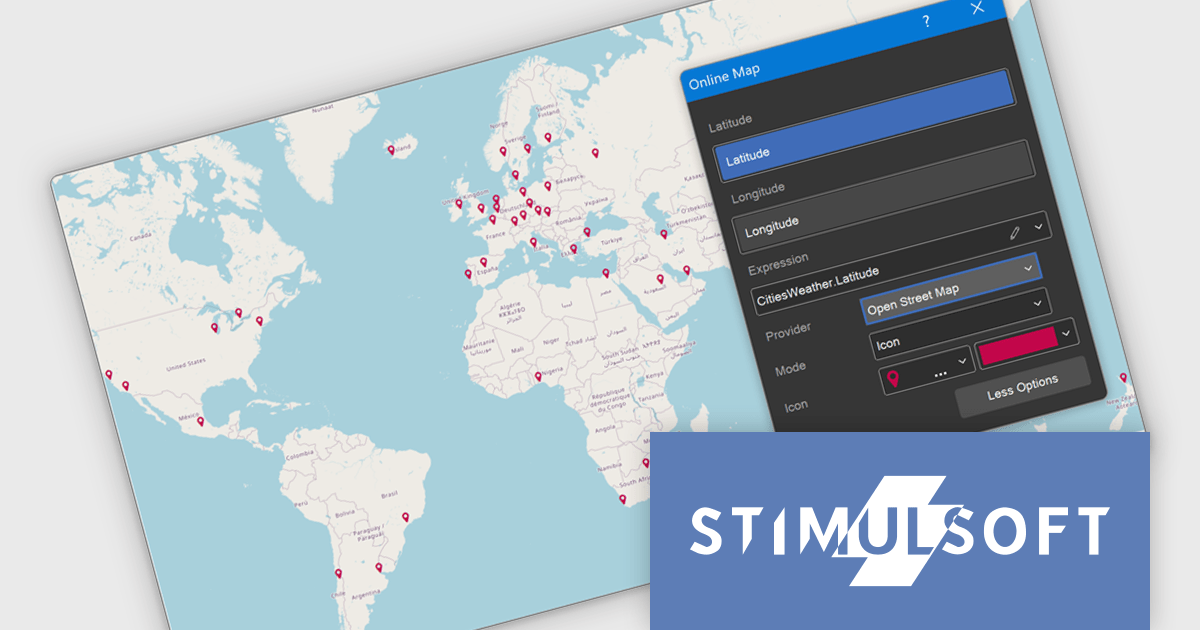
Stimulsoft Dashboards.JS is a JavaScript-based tool for creating interactive dashboards within web applications. Designed for developers and businesses, it provides customizable charts, graphs, and tables to visualize complex data from various sources. It supports popular JavaScript frameworks such as React, Vue.js, and Node.js, enabling seamless integration into modern web projects. With an intuitive interface and responsive design, it suits use cases like business intelligence, performance monitoring, and data-driven decision-making. Stimulsoft Dashboards.JS enhances user engagement and simplifies data analysis for industries such as finance, marketing, and logistics.
The Stimulsoft Dashboards.JS 2025.3.1 update introduces OpenStreetMap as the new default provider for the Online Map dashboard element, enabling developers to implement advanced geospatial visualizations without relying on external API keys. OpenStreetMap offers comprehensive support for multiple visualization modes, including icon, bubble, value, chart, and heat map, allowing for flexible and dynamic data presentation directly within dashboards. With this enhancement, developers gain a reliable, fully integrated mapping solution that aligns with open-source standards and simplifies deployment across projects.
To see a full list of what's new in 2025.3.1, see our release notes.
Stimulsoft Dashboards.JS is licensed per developer and is available as a Perpetual license with 1 year support and maintenance. See our Stimulsoft Dashboards.JS licensing page for full details.
Stimulsoft Dashboards.JS is available individually or as part of Stimulsoft Ultimate.
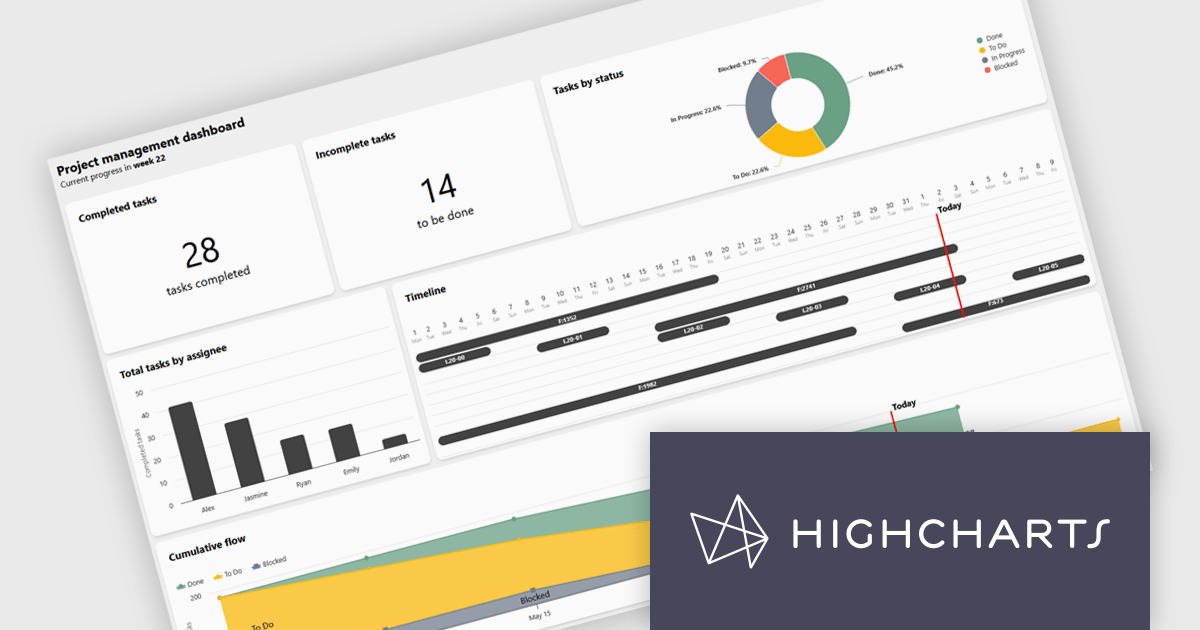
Highcharts Dashboards by Highsoft is a comprehensive platform tailored for software developers seeking efficient data visualization solutions. It offers a robust toolkit for creating interactive dashboards and charts, leveraging the Highcharts library renowned for its flexibility and performance. With support for various data formats and extensive customization options, developers can seamlessly integrate dynamic visualizations into their applications. Highsoft's dashboards empower developers to convey complex data insights effectively, enhancing user experience and decision-making capabilities within their software projects.
Highcharts Dashboards offers a Project Management dashboard that gives users a real-time view of project progress, team workload, and milestones. By consolidating key metrics into an interactive interface, it improves tracking, resource planning, and timeline management. Users can assess deliverable status, identify task dependencies, and align team capacity with project goals. Visual tools like Gantt charts and status overviews improve communication, reduce misalignment, and support more informed decision-making across both agile and traditional workflows.
Highcharts Dashboards is licensed per developer as an Annual or Perpetual License with Internal, Saas, SaaS+ and OEM distribution options. The annual license includes support and all product updates for 1 year and must be renewed to continue to use the software. The perpetual license includes an "Advantage Subscription" for 1 to 5 years which provides support and updates for that period. If you do not renew Advantage then you may continue to use the software at the last release available during the active Advantage period. See our Highcharts Dashboards licensing page for full details.
Learn more on our Highcharts Dashboards product page.
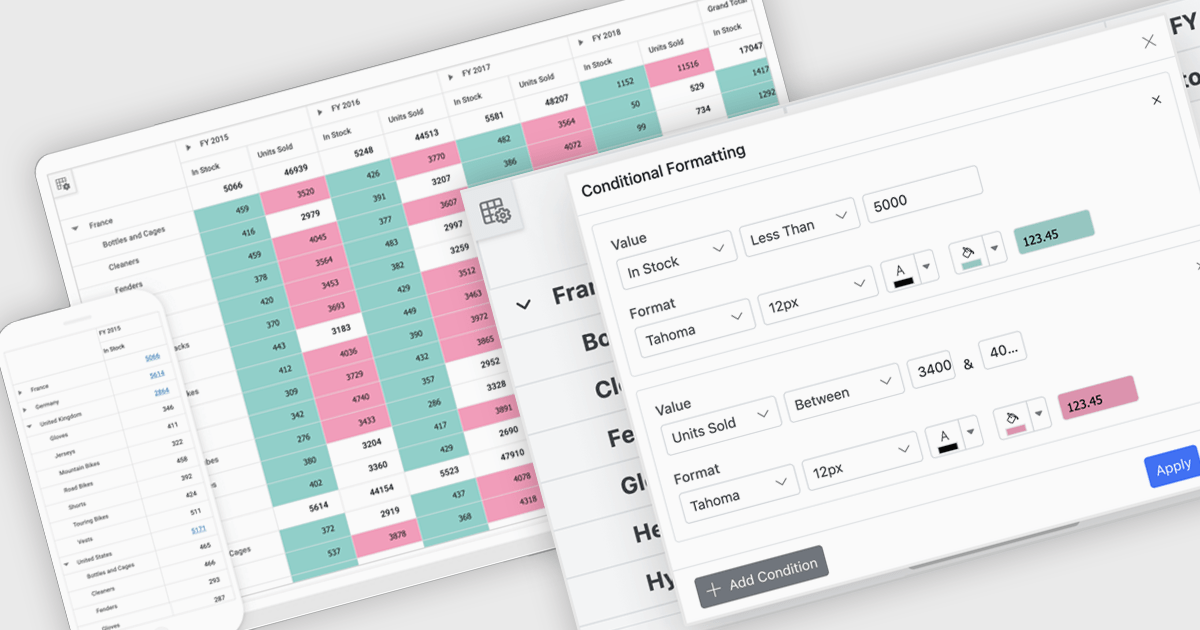
A pivot grid is a powerful data analysis tool that lets users quickly organize and summarize large datasets by rearranging rows, columns, and values. It simplifies reporting by allowing users to group, filter, and aggregate data to uncover patterns and trends. Pivot tables improve clarity, reduce manual calculations, and support flexible data exploration. Common use cases include analyzing sales by product or region, tracking departmental budgets, and creating summary reports for decision making.
Several JavaScript UI suites offer pivot grid components including:
For an in-depth analysis of features and price, visit our comparison of JavaScript UI suites.
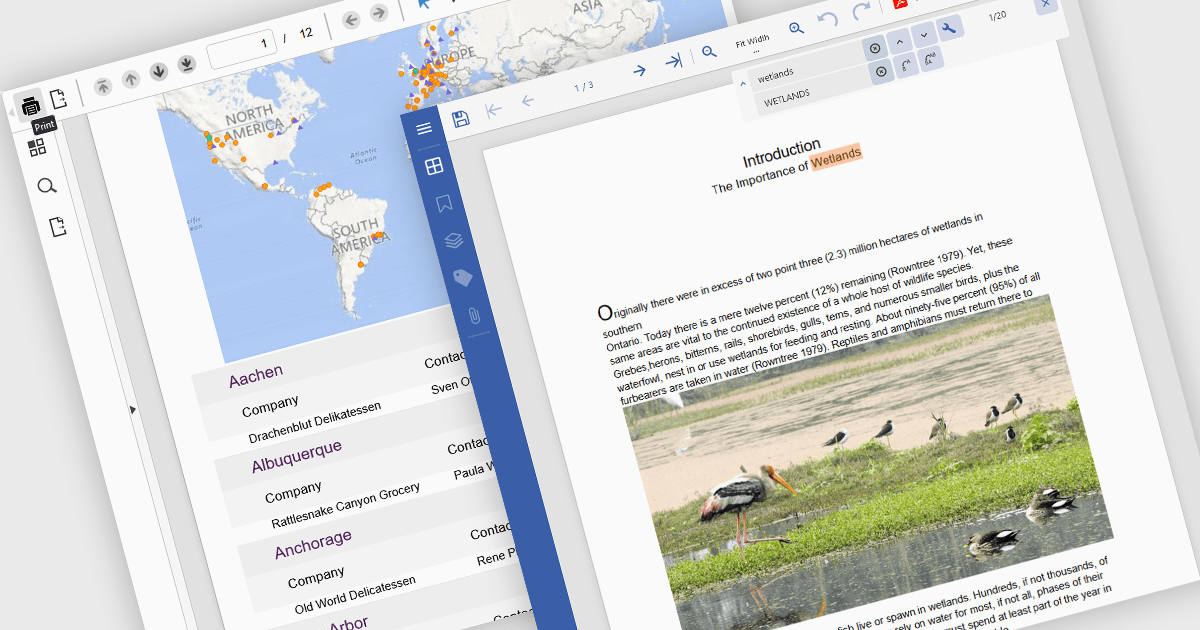
PDF reading and writing capabilities in viewer components are essential for applications that handle document management or display. These features allow developers to integrate PDF interaction directly into web or desktop applications, enabling end-users to open, view, annotate, and sometimes even modify PDF files without relying on external software. By supporting both the consumption and output of PDF content, these components improve workflows across document-heavy environments, such as enterprise reporting, legal systems, and educational platforms.
Common features include:
For an in-depth analysis of features and price, visit our Angular PDF Viewer components comparison.

Sparklines are compact, data-rich graphics embedded within reports to illustrate trends, variations, or patterns over time. These miniature charts, typically rendered as lines, columns, or bars, offer a concise visual summary without the need for full-scale graphs. By integrating sparklines directly into data tables or summaries, reporting tools enable users to quickly grasp performance metrics or fluctuations at a glance, enhancing the interpretability of complex datasets.
Several React reporting controls offer sparklines including:
For an in-depth analysis of features and price, visit our React reporting controls comparison.
電話: (888) 850 9911
Fax: +1 770 250 6199


