


公式サプライヤー
公式および認定ディストリビューターとして200社以上の開発元から正規ライセンスを直接ご提供いたします。
当社のすべてのブランドをご覧ください。
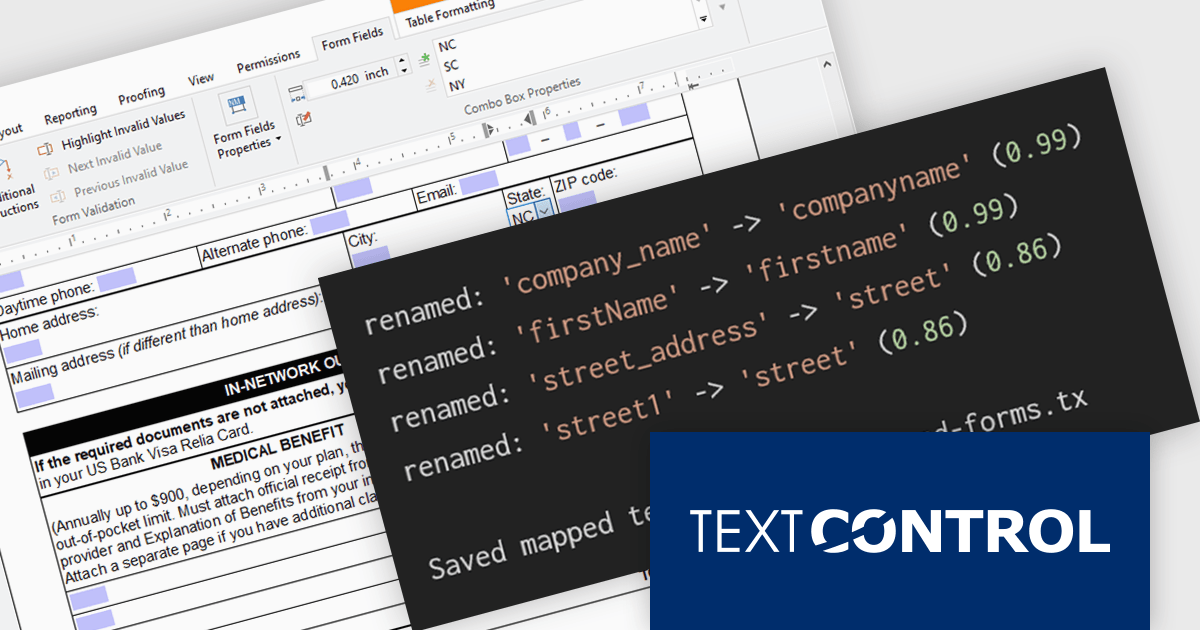
TX Text Control .NET Server for ASP.NET is a server side component for Web applications, or services. It is a fully programmable ASP.NET word processor engine that offers an extensive palette of word processing features. Using TX Text Control .NET Server, programmers can develop server side, end user applications that generate documents on-the-fly, using data from databases, binary files (Microsoft Word DOC and DOCX), ASCII files (XML, RTF, HTML) and image data (JPG, PNG, BMP, TIF, GIF, WMF). Documents can be created, modified and edited in a browser or printed in batch processes.
In this blog post from Text Control, Bjoern Meyer demonstrates how to automatically map TX Text Control form fields to JSON data in a .NET C# application, even when the names are not an exact match. It uses fuzzy matching and is especially useful in cases where templates and data sources evolve independently. The included sample project takes you through the following steps:
Read the complete blog and learn how to automatically prepare templates for JSOPN-based document workflows.
TX Text Control .NET Server for ASP.NET is licensed per developer and is available as a Perpetual License with a 12 month support and maintenance subscription. Run time licenses are required for the deployment to production servers. See our TX Text Control .NET Server for ASP.NET licensing page for full details.
For more information, visit our TX Text Control .NET Server for ASP.NET product page.
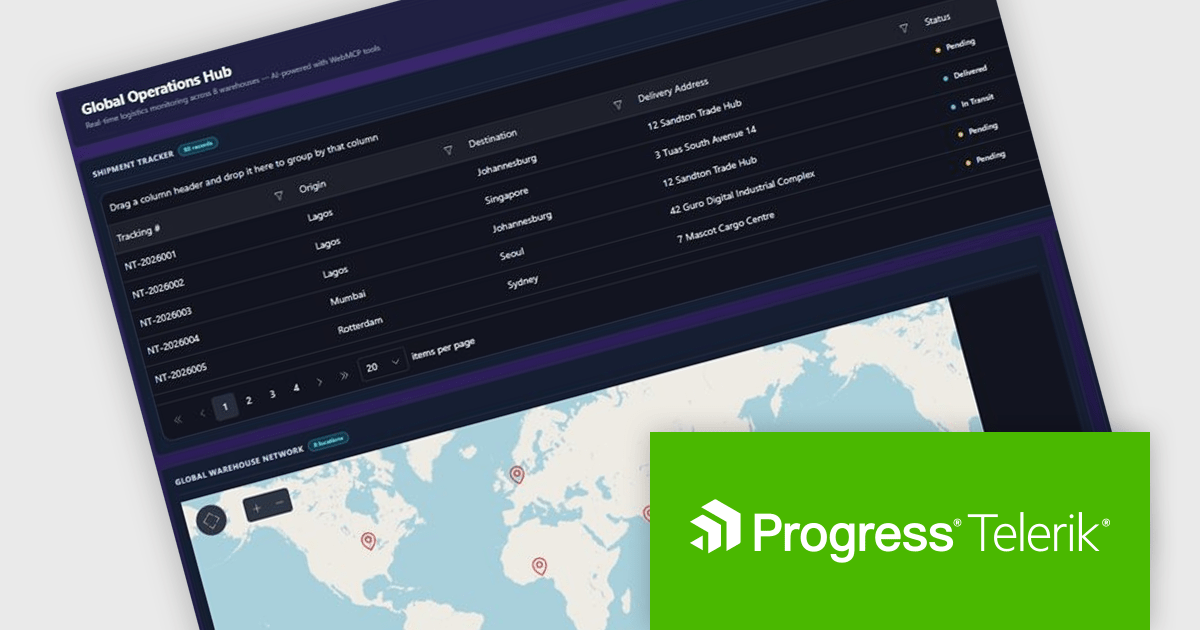
DevCraft by Telerik is a comprehensive suite of more than 1,250 UI components and development tools designed for building modern web, desktop, and mobile applications using .NET and JavaScript frameworks. It includes reporting and report management solutions, automated testing and mocking tools, and document processing libraries, as well as a wide range of professionally designed user interface controls from the Telerik and Kendo UI suites. DevCraft enables developers to create feature-rich, high-performance applications with consistent design and user experience, delivering enterprise-level, scalable, and maintainable software solutions.
The Telerik DevCraft 2026 Q2 update introduces WebMCP integration as a preview feature, enabling developers to explore applications that work directly with AI agents through structured interactions. By exposing application functionality as actionable tools, it allows AI agents to perform tasks such as filtering data, navigating views, and updating values without relying on DOM scraping or simulated user actions. This preview helps developers evaluate more reliable AI driven workflows, simplify the implementation of intelligent application experiences, and prepare their applications for emerging AI standards and use cases.
To see a full list of what's new in DevCraft 2026 Q2, see our release notes.
Telerik DevCraft is licensed per developer and has two licensing models: an annual Subscription License and a Perpetual License. The Subscription license provides access to the latest product updates, technical support, and exclusive benefits for a flat annual fee, and must be renewed to continue using the software. The Perpetual license is a one-time purchase granting access to the current released version and includes one-year Maintenance and Support. After this initial period, users can choose to renew Maintenance & Support to continue receiving updates and support; otherwise, they may continue using the installed version available during their active maintenance period but will forgo future updates and support. See our Telerik DevCraft Ultimate licensing page for full details.
For more information, see our product pages:
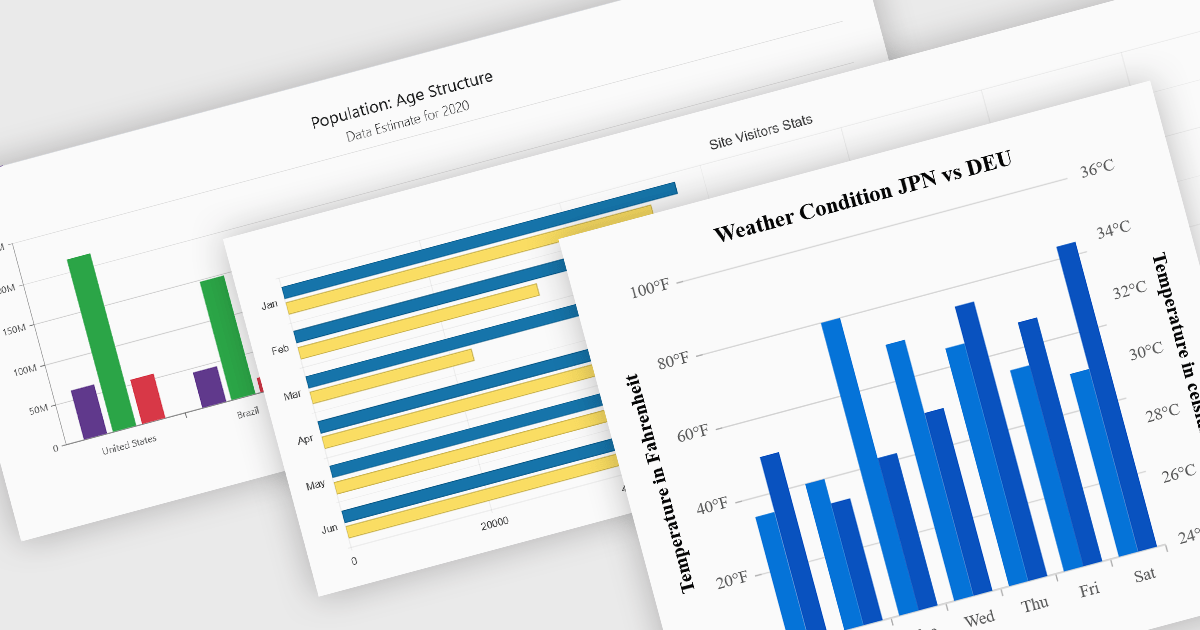
Column and bar charts are among the most widely used data visualization features in modern charting components, helping developers present comparisons, trends, and category-based metrics in a format that is easy to interpret. By displaying values as horizontal or vertical bars, these chart types allow applications to communicate changes in performance, rankings, distributions, and other business data with clarity. Modern charting components typically support customization options such as stacked series, grouped categories, animations, tooltips, responsive layouts, and interactive behaviors, enabling developers to create dashboards and reporting experiences that suit a wide range of enterprise and analytical scenarios.
Several Blazor chart controls offer column and bar charts including:
For an in-depth analysis of features and price, visit our Blazor chart controls comparison.
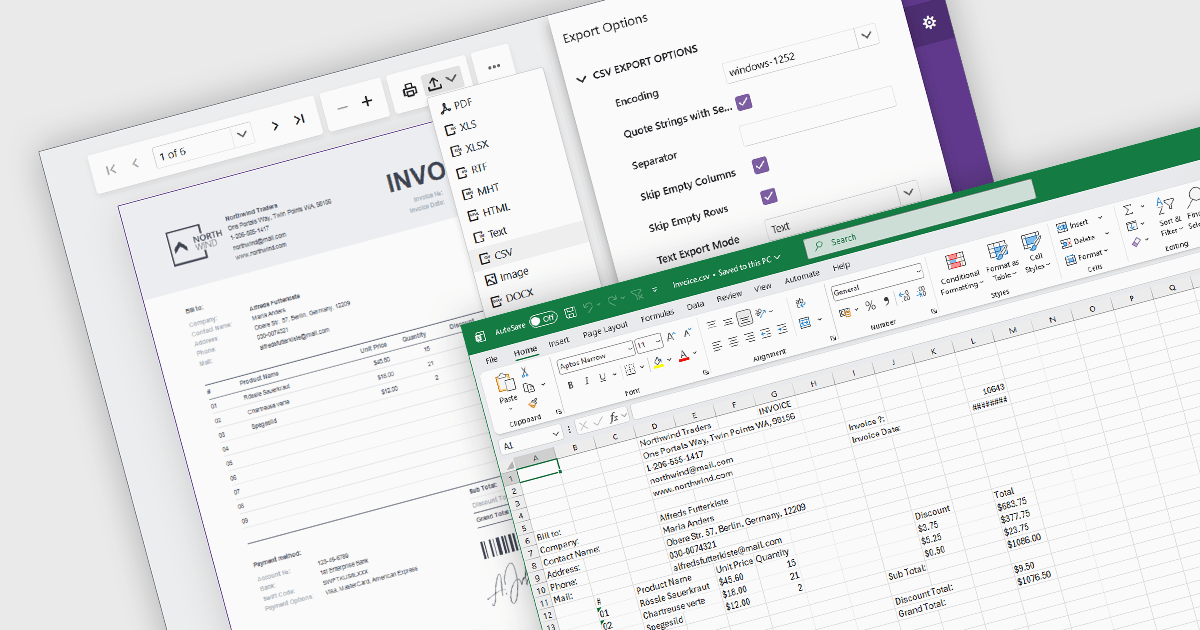
Exporting reports to CSV (Comma-Separated Values) format provides a simple and widely compatible way to transfer report data into spreadsheet applications, databases, analytics platforms, and other business systems. CSV files store structured data as plain text, making them easy to process, automate, archive, and exchange across different environments. For software developers and business users, CSV export functionality supports data analysis, operational reporting, integration workflows, and data retention requirements while maintaining low file complexity and broad platform support.
Several Blazor reporting components allow you to export to CSV, including:
For an in-depth analysis of features and price, visit our comparison of Blazor reporting components.
DevExpress Blazor (part of DevExpress ASP.NET and Blazor) helps you create high-impact user experiences for both Blazor Server and Blazor WebAssembly using C#. The Blazor UI Component Library ships with a comprehensive set of native components including a Grid, Pivot Table, Scheduler, Chart, Data Editors and Reporting.
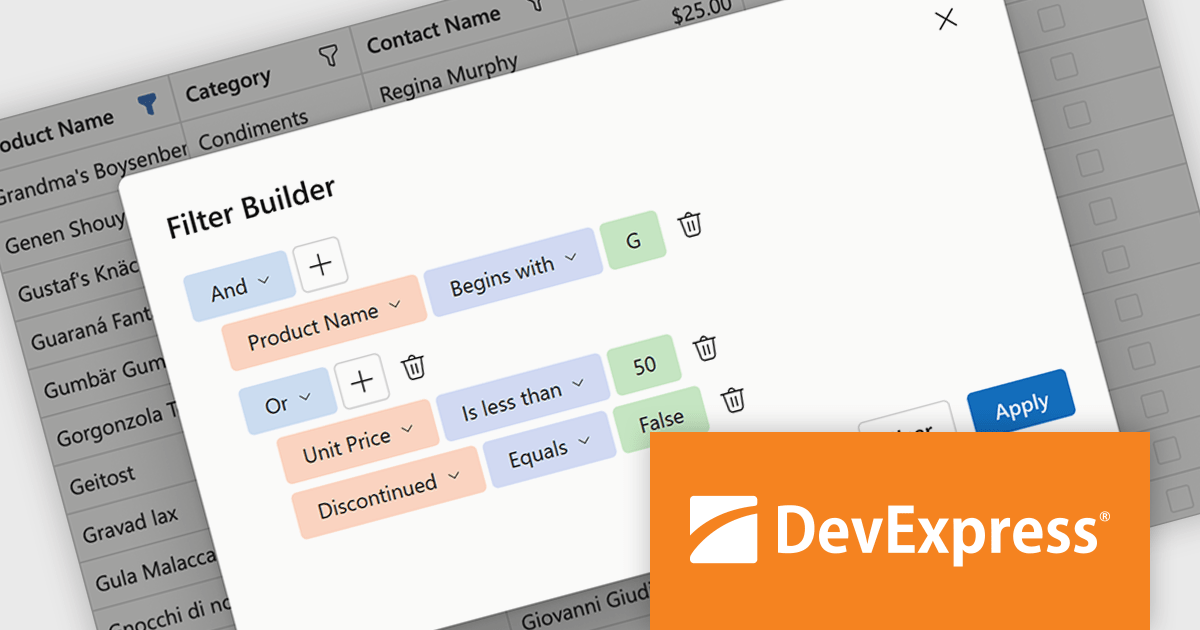
DevExpress Blazor now includes an integrated Filter Builder for its Grid and TreeList components, making it easier for users to define advanced filtering criteria through a visual interface. Filter Builder fields are generated automatically from existing data columns, so developers can add sophisticated filtering capabilities without extra configuration or custom implementation work. This approach helps users work with large datasets more efficiently while maintaining a consistent experience across Blazor applications.
DevExpress ASP.NET and Blazor is licensed per developer and is available as a Perpetual License with a 12 month support and maintenance subscription. See our DevExpress ASP.NET and Blazor licensing page for full details.
DevExpress Blazor is available in the following products:
電話: (888) 850 9911
Fax: +1 770 250 6199


