


公式サプライヤー
公式および認定ディストリビューターとして200社以上の開発元から正規ライセンスを直接ご提供いたします。
当社のすべてのブランドをご覧ください。
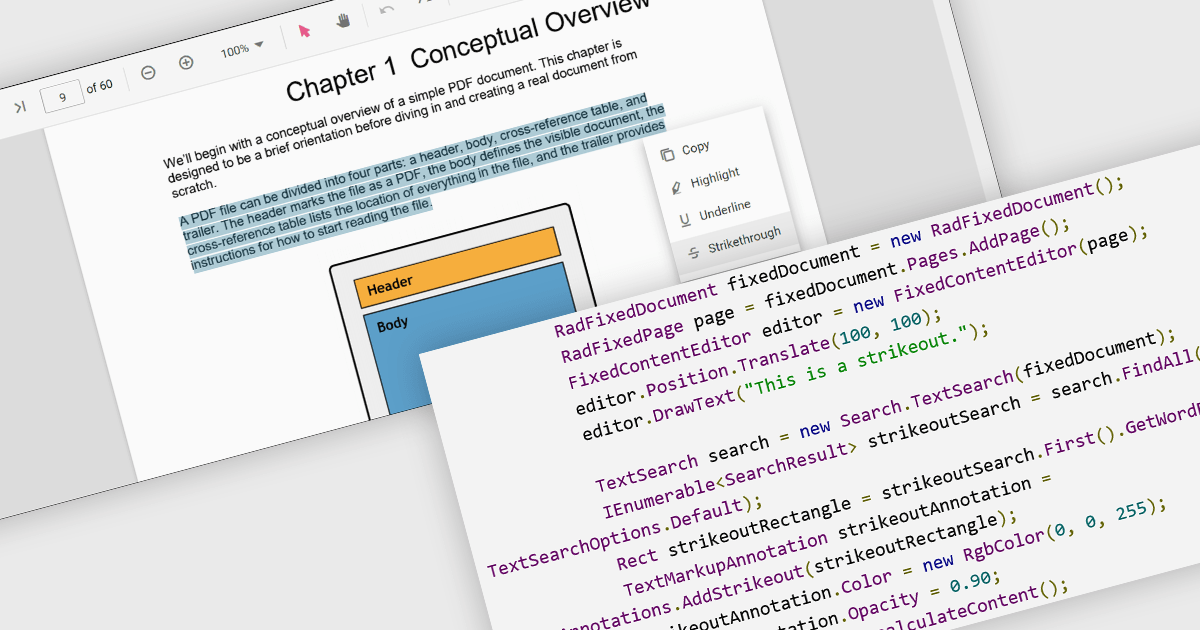
At a high level, strikethrough annotations, also known as strikeout or line-through markups, enable reviewers to visually indicate deletions or corrections within PDF text while preserving the underlying content. This annotation type belongs to the broader category of text markup annotations, which also includes highlighting, underlining, and squiggly underlines. Developers can customize properties like color, opacity, and associated notes or author metadata. Strikethrough annotations support interactive use cases, such as insert/edit/delete, event handling, and rendering consistency across different rendering engines.
Several WinForms PDF controls offer support for strikethrough annotations including:
For an in-depth analysis of features and price, visit our WinForms PDF controls comparison.
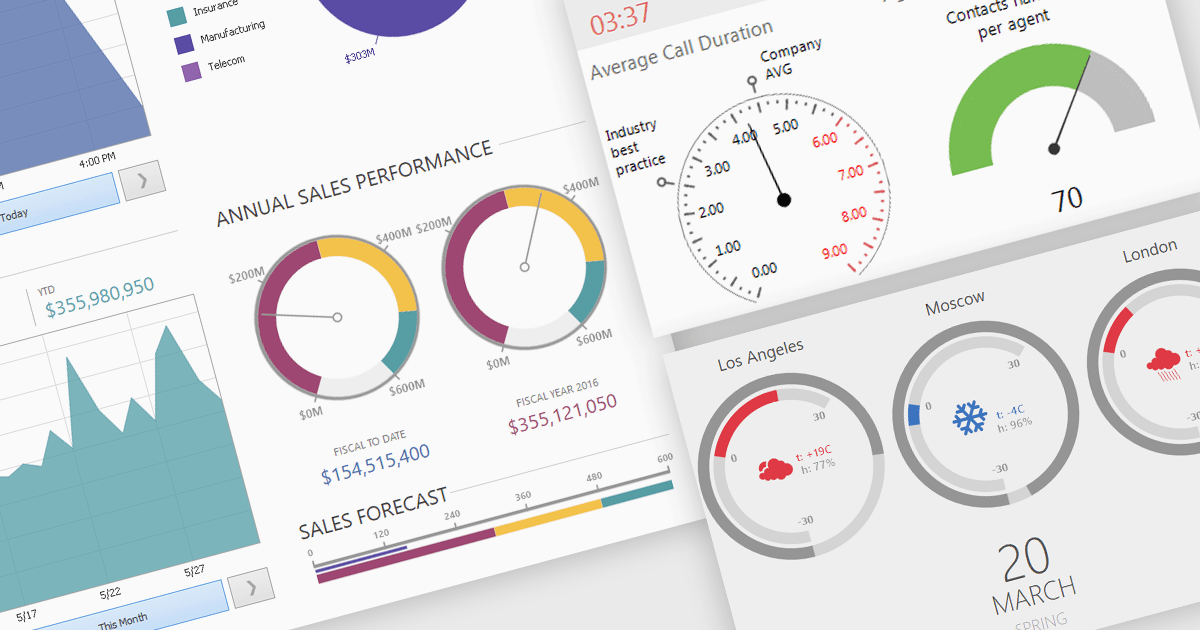
A gauge is a visual reporting element, such as a dial, meter, or progress bar, designed to display a single metric’s value in relation to defined targets or thresholds. For software developers, gauges offer a quick and intuitive way to present key performance indicators, making it immediately clear whether performance is on track, exceeding expectations, or requires attention. By transforming raw data into a simple, at-a-glance visual, gauges reduce the need for users to analyze complex tables or charts, improve the readability of dashboards and reports, and support faster, more informed decision-making.
Several .NET Winforms Reporting controls include Gauges including:
For an in-depth analysis of features and price, visit our comparison of .NET Winforms Reporting Controls.
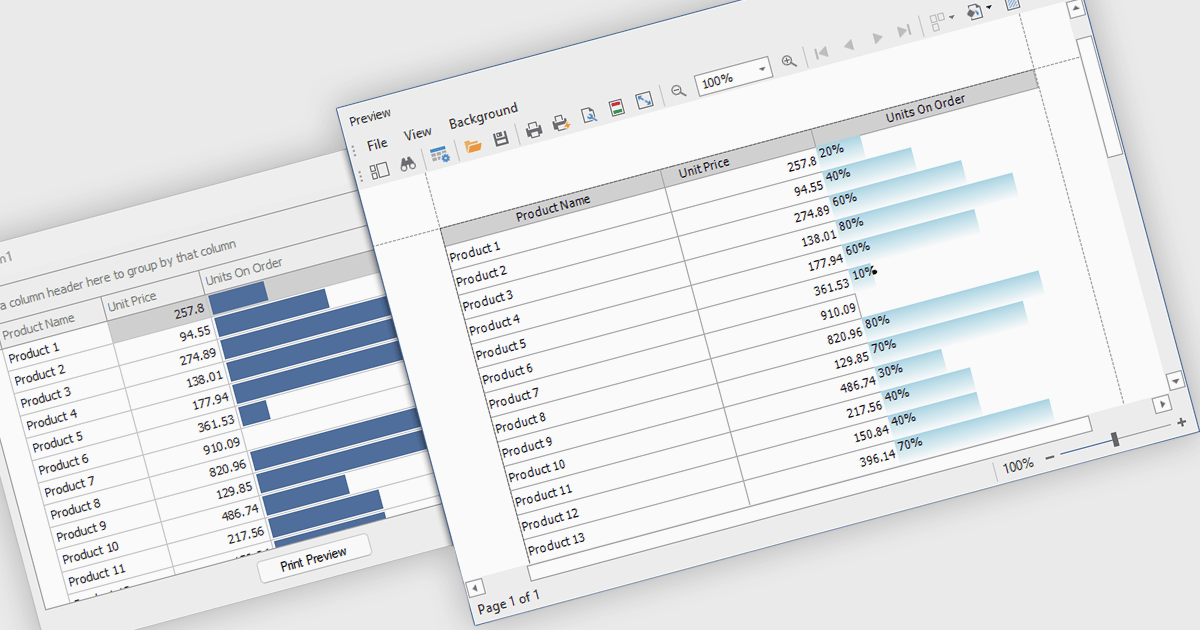
ProgressBar cell types in a .NET WinForms grid control are specialized cells that visually represent progress or completion levels within a grid layout, using horizontal progress bars. These cells are particularly useful for tracking status indicators, such as task completion or data processing percentages, directly within tabular views. They provide a clear, immediate representation of numeric progress values, enhancing readability without requiring users to interpret raw numbers. For developers, integrating ProgressBar cells simplifies the task of conveying progress-related information in data-driven interfaces, offering a familiar and consistent user experience aligned with standard Windows Forms controls.
Several .NET WinForms grid controls offer ProgressBar cell type controls, including:
For an in-depth analysis of features and price, visit our .NET WinForms grid controls comparison.
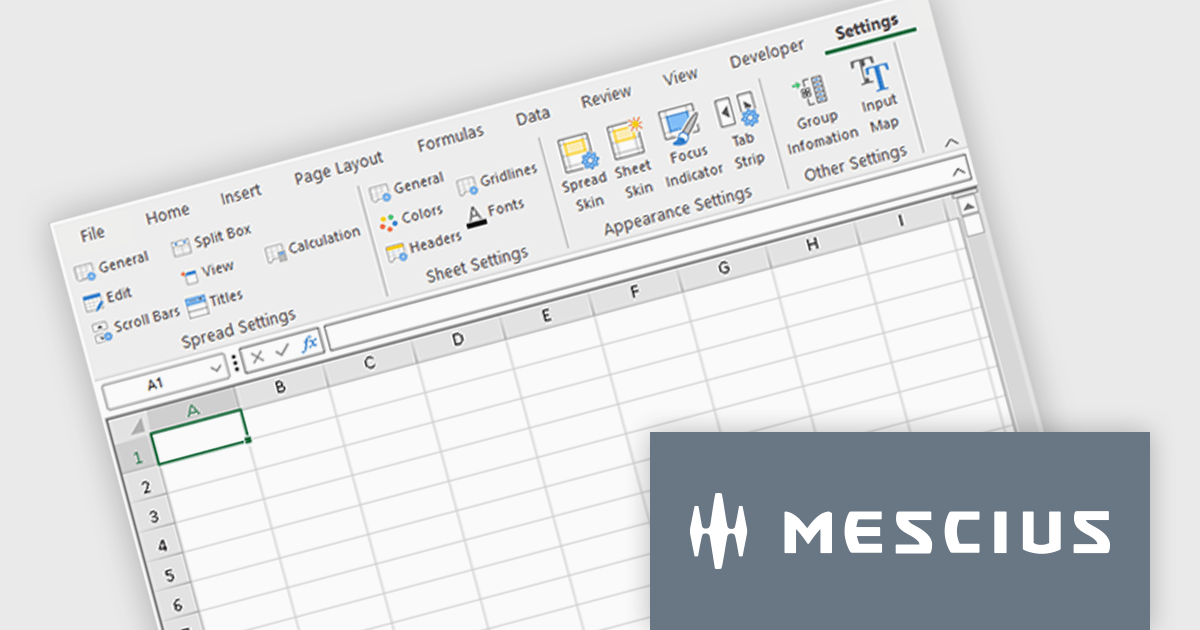
Spread.NET by MESCIUS is a powerful tool for building Excel-like applications in your .NET projects. It lets you create interactive spreadsheets, grids, dashboards, and even forms within WinForms, ASP.NET, and WPF applications. With its rich feature set, including a robust calculation engine, formula support, and Excel compatibility, Spread.NET empowers developers to build data analysis tools, budgeting apps, scientific dashboards, and more, all within the familiar .NET environment.
The Spread.NET 18.2 update refines the RibbonBar in WinForms to improve the efficiency and clarity of UI design during development. With expanded icon visibility, developers can more easily access and identify commands, reducing visual ambiguity and speeding up layout tasks. The addition of new layout options for the collapsed state offers greater control over how the RibbonBar adapts to different form sizes, enabling more responsive and space-efficient interface designs. These improvements help streamline the design-time experience, allowing developers to build cleaner, more functional applications with less manual configuration.
To see a full list of what's new in v18.2, see our release notes.
Spread.NET is licensed per developer and is available as a Perpetual License with a 12 month support and maintenance subscription. We can supply any Spread.NET license including new licenses, maintenance renewals, and upgrade licenses. See our Spread.NET licensing page for full details.
For more information, visit our Spread.NET product page.
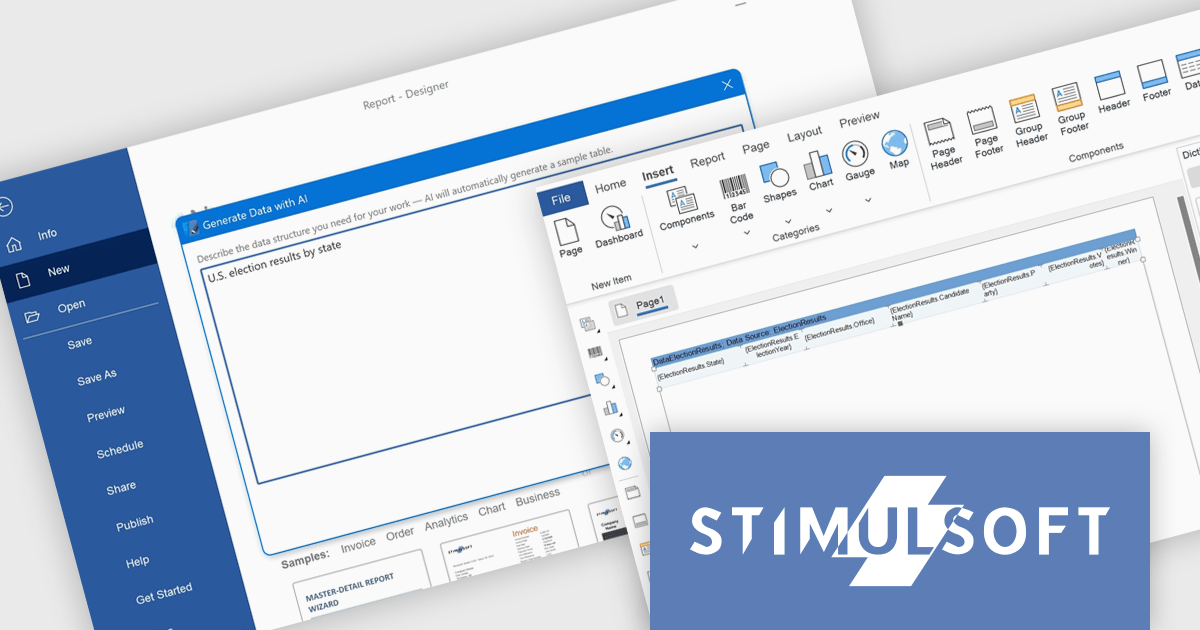
Stimulsoft Dashboards.WIN is a versatile suite of tools for crafting interactive data visualizations for web and desktop applications. It empowers developers to embed intuitive dashboards across various platforms, using platform-specific components or a centralized cloud designer. With data analysis elements, customization options, and pre-built templates, Stimulsoft Dashboards helps you transform complex data into clear, actionable insights for any audience.
The latest Stimulsoft Dashboards.WIN update introduces AI-powered data generation, enabling developers to quickly create realistic sample datasets using natural language prompts directly within the report designer. This improves the prototyping process by removing the need for manual data setup or external demo files, allowing for faster iteration, testing, and visualization of report layouts.
Stimulsoft Dashboards.WIN is licensed per developer and is available as a perpetual license with 1 year support and maintenance. See our Stimulsoft Dashboards.WIN licensing page for full details.
Stimulsoft Dashboards.WIN is available individually or as part of Stimulsoft Ultimate.
電話: (888) 850 9911
Fax: +1 770 250 6199


