


公式サプライヤー
公式および認定ディストリビューターとして200社以上の開発元から正規ライセンスを直接ご提供いたします。
当社のすべてのブランドをご覧ください。
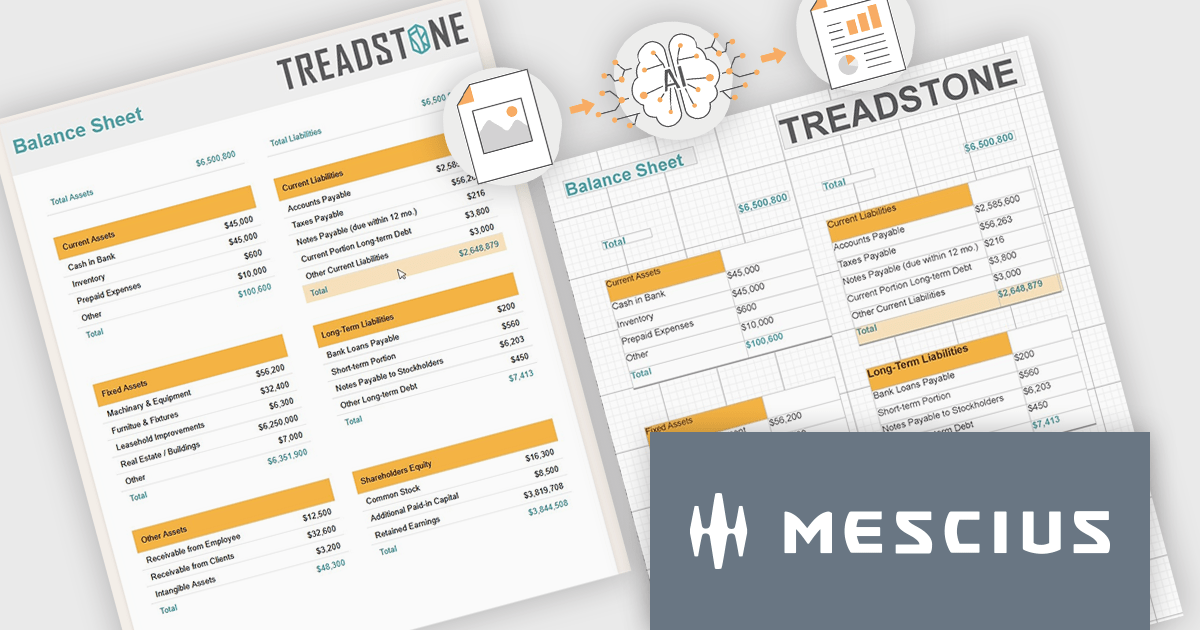
ActiveReports.NET by MESCIUS is a reporting solution for the Microsoft .NET platform that enables developers to create and deliver data-driven reports in web, desktop, and cloud applications. It supports multiple report types, including section, page, and RDL (Report Definition Language) reports, and provides visual designers, a robust rendering engine, and export options such as PDF and Excel. Designed to integrate with modern .NET and ASP.NET Core applications, it helps teams build interactive, enterprise-grade reporting features into their software.
The ActiveReports.NET v20 update introduces a new AI powered image to report capability that enables developers to convert static report images such as screenshots, mockups, PDFs, or even photos of printed pages into fully editable report layouts in minutes. By leveraging Azure Document Intelligence to analyze page structure, text, and visual elements, it significantly reduces the manual effort required to recreate existing reports, accelerates the modernization of legacy assets, and streamlines migrations from other reporting platforms. This capability provides a practical starting point for rebuilding or refining reports while preserving full control over layout structure, styling, grouping, and data bindings to ensure alignment with application architecture and development standards.
To see a full list of what's new in v20, see our release notes.
ActiveReports.NET is licensed per developer. Dependent on geographic location it is available as either an Annual (Timed) Subscription License or as a Perpetual Developer License which comes with 1 year of software updates and support. Each developer requires a license to design, develop, or maintain applications. The Annual Subscription License must be renewed each year to continue to work with the software. Published applications are royalty free and do not expire. Optional pipeline licenses available for CI/CD build servers. See our ActiveReports.NET licensing page for full details.
Learn more on our ActiveReports.NET product page.
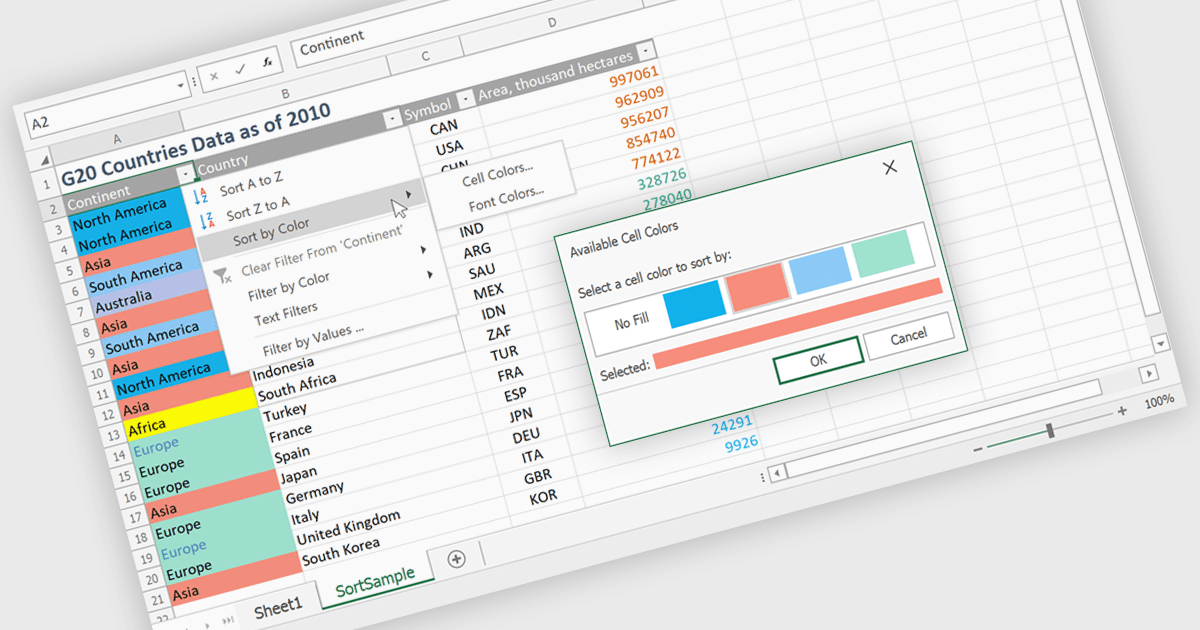
Data sorting in a spreadsheet is the process of arranging data in a specific order such as alphabetically, numerically, or by date based on one or more columns. It enables users and developers to quickly organize large datasets, improve readability, and surface meaningful insights such as top performing products, recent transactions, or lowest inventory levels. By supporting multi level sorting, for example by region and then by revenue, spreadsheets maintain row integrity while delivering structured and analysis ready views of data. Common use cases include ranking sales performance, organizing customer lists, managing financial records, preparing reports, and enhancing interactive data grids within business applications.
Several .NET WinForms spreadsheet controls allow you to sort data, including:
For an in-depth analysis of features and price, visit our comparison of .NET WinForms spreadsheet controls.
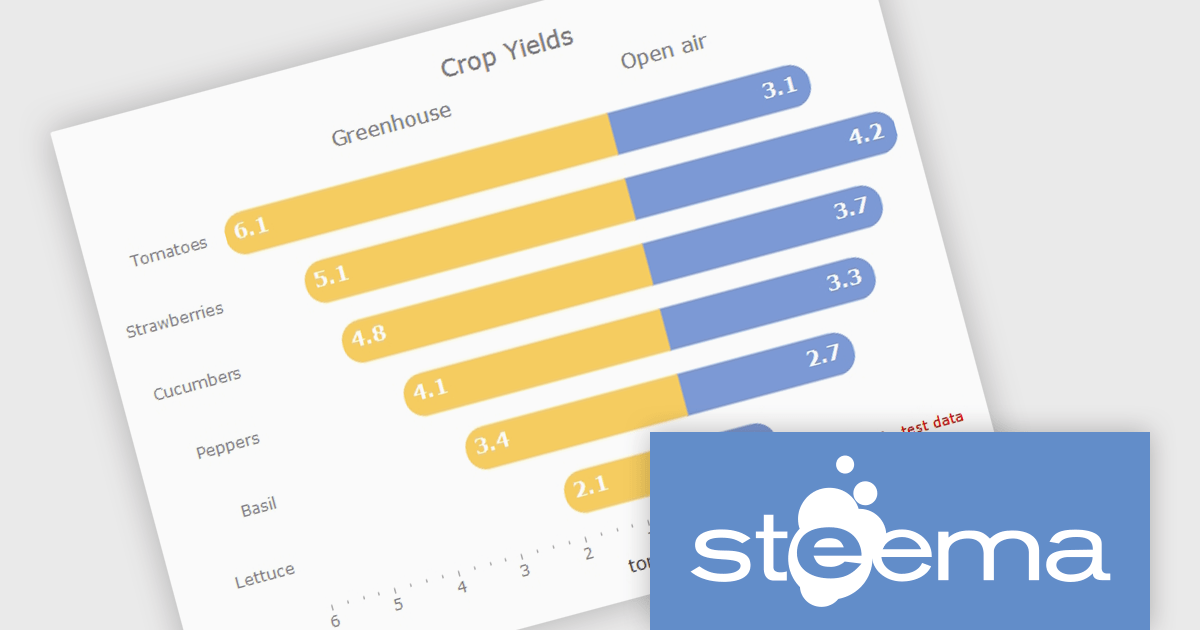
TeeChart for .NET is a comprehensive charting solution that enables developers to create informative, visually compelling charts for financial, scientific, statistical, and business applications. It manages complex data and delivers interactive visualizations. With optional source code and enterprise editions that include mobile and JavaScript components, TeeChart for .NET provides flexibility, customization, and consistent charting across desktop, web, and mobile platforms.
The TeeChart for .NET 2006 update introduces a Tornado Chart series type that enables developers to present structured side-by-side comparisons and perform sensitivity analysis. This chart type is particularly effective for highlighting the relative impact of multiple variables, making it well suited for financial modeling, risk assessment, and analytical dashboards. By offering built-in support within the existing TeeChart framework, it reduces the need for custom visualization logic, accelerates development time, and ensures consistent integration across reporting, analytics, and business applications.
To see a full list of what's new in version 2026, see our release notes.
TeeChart for .NET is licensed per developer and is available as a perpetual license. Each license includes one year of updates and upgrades. See our TeeChart for .NET Pro Edition licensing page for full details.
This update for TeeChart for .NET is available is available in the following products:
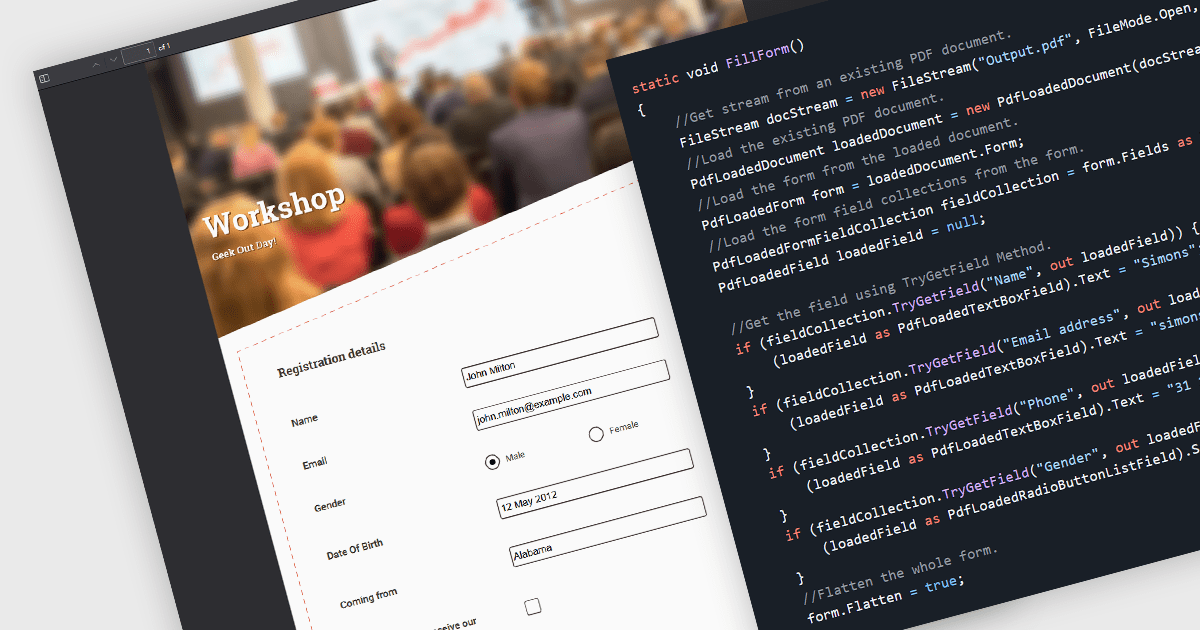
Flattening form fields is the process of converting interactive PDF form elements into static content within the document. Once flattened, the data entered into fields becomes part of the page itself, preventing further editing or manipulation. This ensures that the document can be viewed consistently across devices and PDF readers, while preserving the integrity of the submitted information. It is particularly valuable for finalized contracts, reports, and compliance documents where maintaining an accurate, unalterable record is essential.
Several WinForms PDF components allow you to flatten form fields, including:
For an in-depth analysis of features and price, visit our comparison of WinForms PDF components.
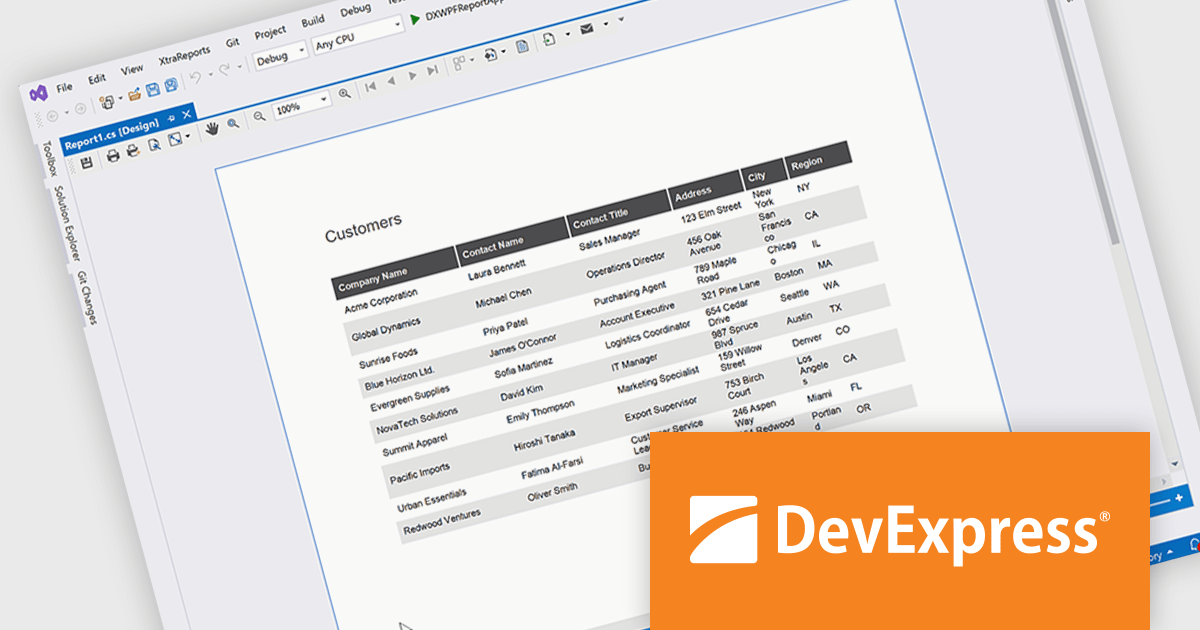
DevExpress Reporting is a comprehensive suite of reporting tools that empowers developers to create visually stunning and highly customizable reports for various applications. With its rich feature set, including data binding, layout design, printing, and exporting capabilities, DevExpress Reporting enables the efficient creation of reports that meet the most demanding business requirements.
The DevExpress Reporting 25.2 update allows developers to generate AI-generated test data to preview reports directly within the Visual Studio and End-User Report Designers for WinForms and WPF. By removing the need to connect to a live data source during design, it supports faster iteration and easier layout validation. This is particularly valuable when production data is unavailable or when sharing report templates that must not include sensitive information.
To see a full list of what's new in version 25.2, see our release notes.
DevExpress Reporting is licensed per developer and is available as a Perpetual License with a 12 month support and maintenance subscription. See our DevExpress Reporting licensing page for full details.
DevExpress Reporting is available to buy in the following products:
電話: (888) 850 9911
Fax: +1 770 250 6199


