


公式サプライヤー
公式および認定ディストリビューターとして200社以上の開発元から正規ライセンスを直接ご提供いたします。
当社のすべてのブランドをご覧ください。
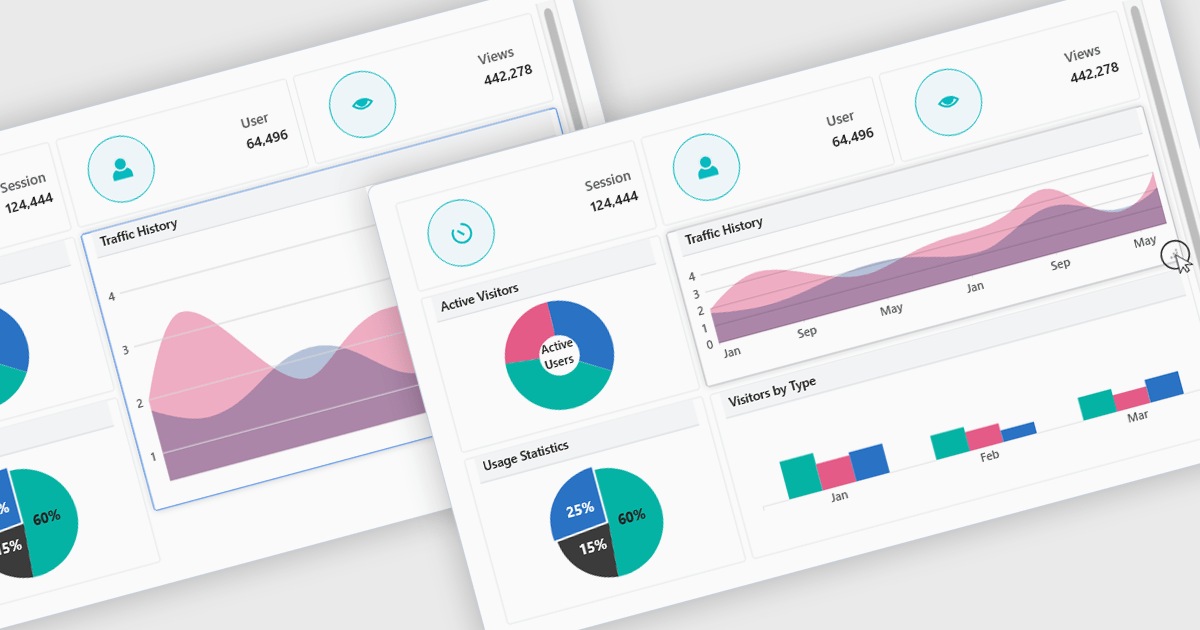
In a UI suite, layout refers to the arrangement and alignment of interface elements, such as widgets, charts, controls, and navigation bars, into a coherent structure that prioritizes usability and visual hierarchy. Effective layouts ensure that users can intuitively find and interact with content, while developers benefit from built-in support for responsive grids, flexible spacing, and adaptive positioning that simplifies the creation of consistent interfaces across devices.
Several .NET Blazor UI suites offer layout components including:
For an in-depth analysis of features and price, visit our .NET Blazor UI suites comparison.
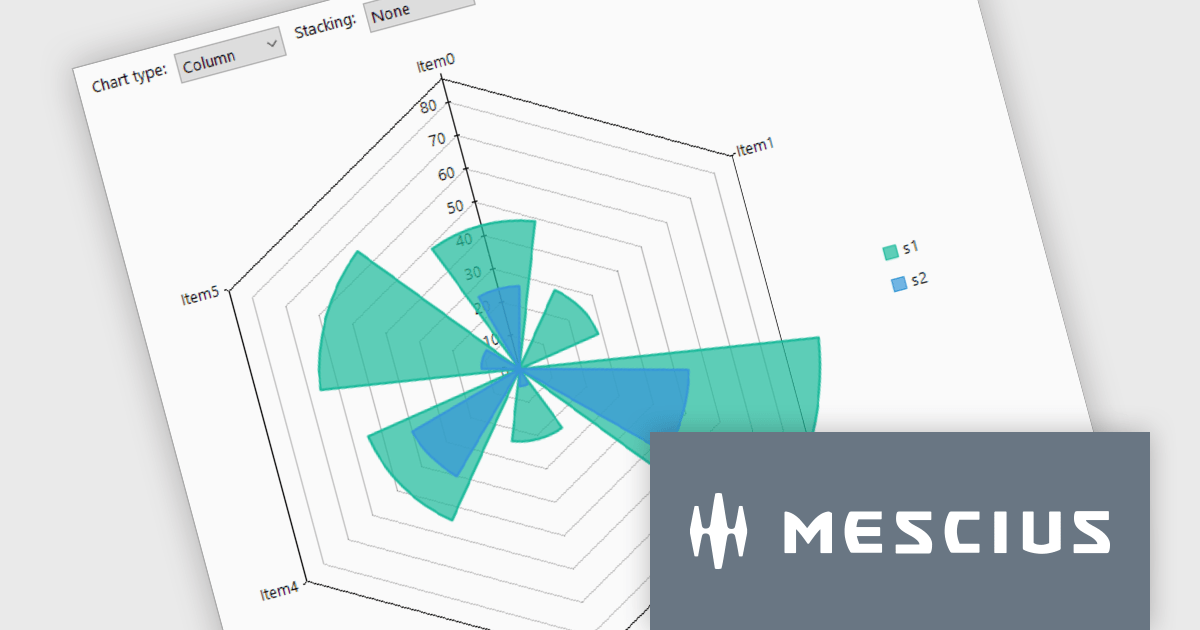
ComponentOne Studio WinForms by MESCIUS is a comprehensive toolkit offering over 120 advanced UI components to streamline Windows Forms application development. It empowers you to build visually appealing and feature-rich applications with functionalities like data visualization through charts and reports, intuitive data editing with performant grids, and modern UI elements including ribbons and docking for a user-friendly experience.
The ComponentOne Studio WinForms v2025 v1 update enhances its FlexChart control by introducing a new Column Radar chart type. FlexRadar now supports Column chart types with stacking options. This addition allows developers to visualize multivariate data in a more structured and intuitive format, particularly for applications requiring radial data representation such as wind rose charts. By aligning columns radially and enabling stacking, the chart makes it easier to compare the magnitude and distribution of values across categories, helping users identify patterns and trends more effectively. This new chart type expands the flexibility of radar-based visualizations, making it a valuable tool for scientific, engineering, and environmental data analysis.
To see a full list of what's new in 2025 v1, see our release notes.
ComponentOne Studio WinForms is licensed per developer on a perpetual basis and includes a 12 month subscription. Priority Support is also available. See our ComponentOne Studio WinForms licensing page for full details.
Learn more on our ComponentOne Studio WinForms product page.
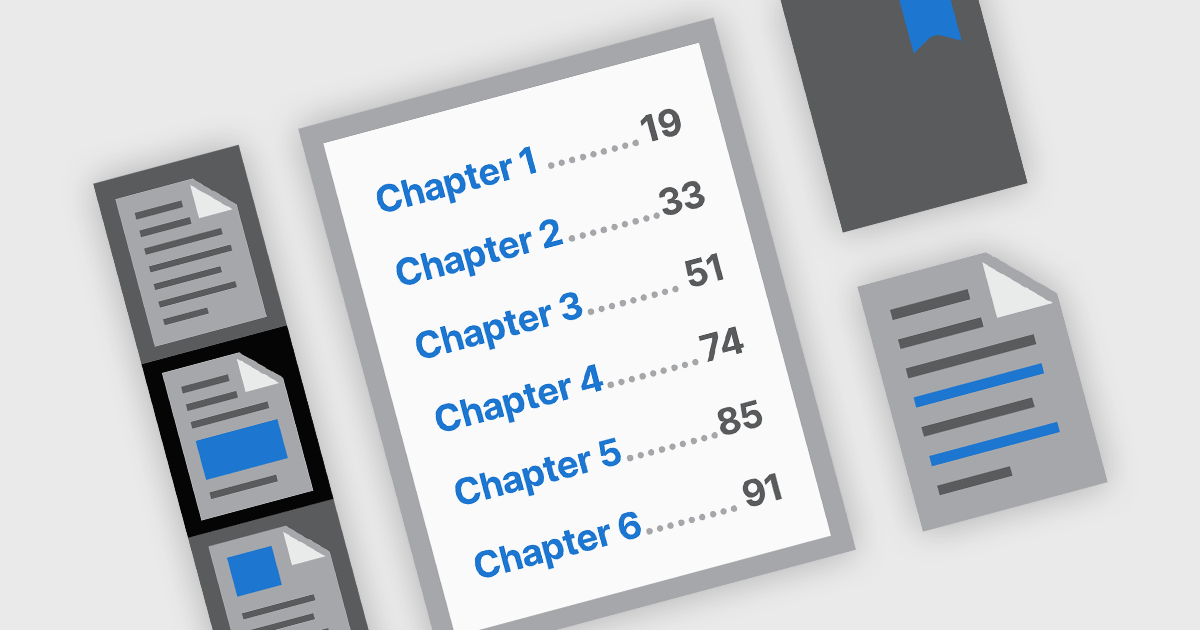
PDF navigation features play a crucial role in enhancing the usability and accessibility of digital documents. In modern PDF components, navigation tools are designed to provide intuitive access to document content, helping users locate specific sections, pages, or topics quickly. These tools are particularly important in lengthy or complex PDFs such as manuals, reports, and eBooks, where efficient navigation can significantly improve the reading experience and reduce time spent searching for information.
Common features include:
For an in-depth analysis of features and price, visit our .NET PDF components comparison.
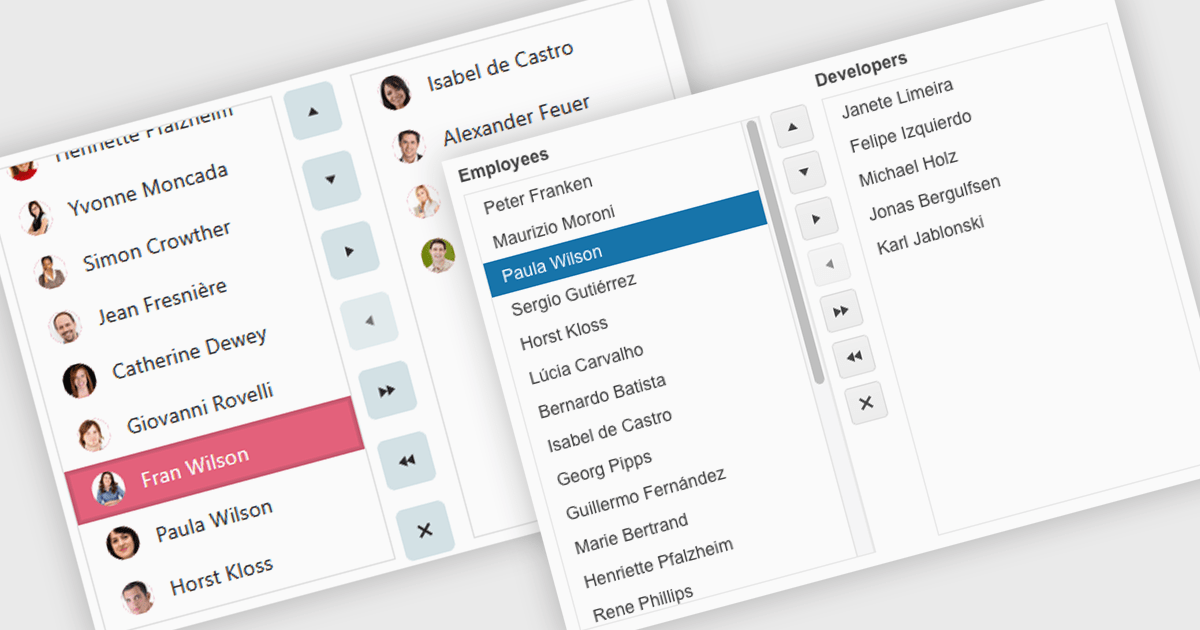
Listboxes are interactive controls that present users with a scrollable list of predefined options, allowing single or multiple selections without manual entry. By constraining inputs to valid choices and offering keyboard navigation, real-time filtering, and drag-and-drop reordering, they reduce errors and help maintain data integrity. Additionally, customizable templates let developers incorporate icons, colors, or detailed item descriptions, making complex data sets easier to scan. Overall, listboxes offer a compact, intuitive interface that balances flexibility with consistency, boosting productivity wherever structured data selection is needed.
Several .NET Blazor data editor collections can provide you with a listbox including:
For an in-depth analysis of features and price, visit our .NET Blazor data editors comparison.
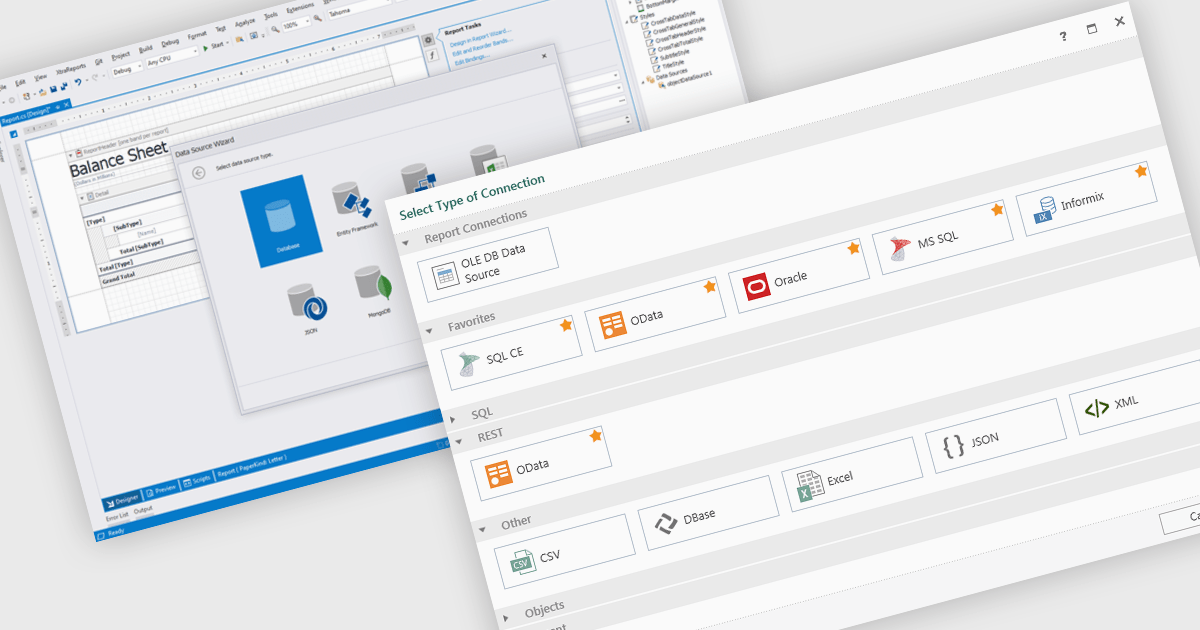
Data connectivity is a foundational aspect of modern reporting components, enabling applications to retrieve and present data from a wide variety of sources. Whether integrating with relational databases, cloud services, or flat files, effective data connectivity ensures that reports reflect current, accurate information. Reporting components are designed to abstract the complexity of accessing these data sources, providing developers with flexible APIs and tools to bind data into visualizations and formatted reports.
Common features include:
For an in-depth analysis of features and price, visit our Blazor reporting components comparison.
電話: (888) 850 9911
Fax: +1 770 250 6199


