


公式サプライヤー
公式および認定ディストリビューターとして200社以上の開発元から正規ライセンスを直接ご提供いたします。
当社のすべてのブランドをご覧ください。
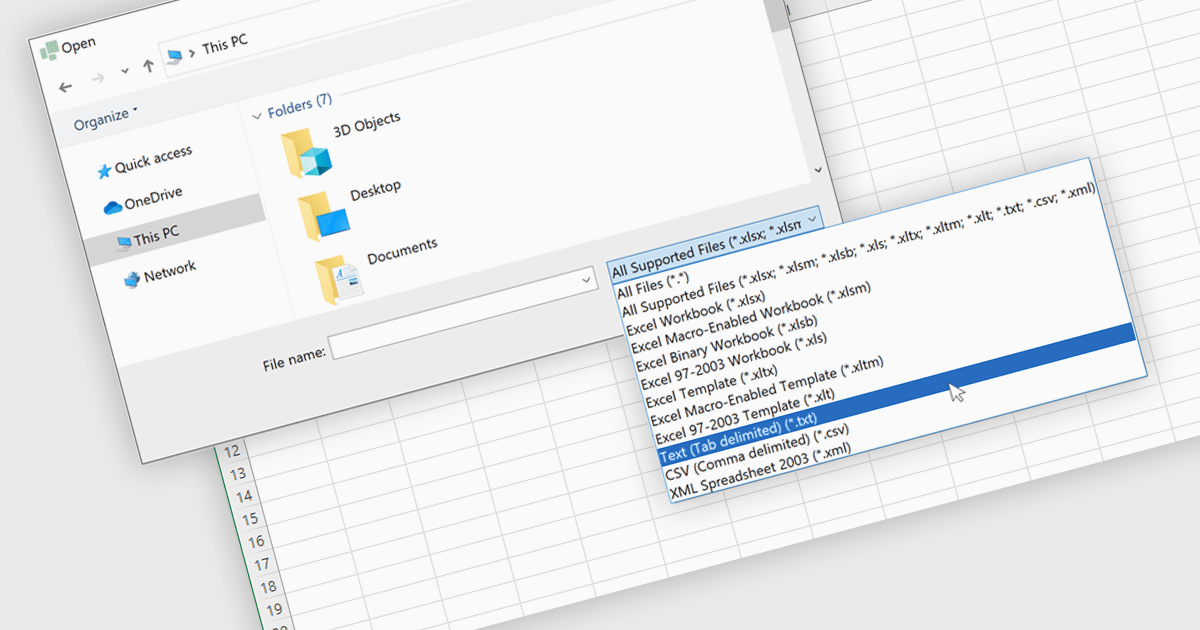
Importing TXT files into spreadsheet applications allows developers and users to load in plain text data, typically delimited by characters such as commas or tabs, and transform it into structured, editable tables within a spreadsheet-like environment. This process enables users to work with externally sourced or manually created text data using the familiar tools and features of a spreadsheet, such as sorting, filtering, and formula calculations. Loading a text file into an Excel-like format removes the need for manual data entry and simplifies data processing. Support for TXT file imports makes spreadsheet applications more versatile by improving the integration of external data and helping users process information more efficiently. It reduces the workload associated with data processing and ensures that data is quickly available in a usable format for analysis or reporting.
Several WinForms spreadsheet controls allow you to import files in TXT format:
For an in-depth analysis of features and price, visit our comparison of WinForms spreadsheet controls.

PDF components provide developers with a set of tools for programmatically handling Portable Document Format (PDF) files within applications. These components enable both the creation and manipulation of PDF documents, supporting a wide range of document workflows across platforms and industries. By integrating such components, developers can build features for generating reports, rendering documents for viewing, or embedding print-ready files in business applications, often without relying on external software or services.
Common features include:
For an in-depth analysis of features and price, visit our ASP.NET Core PDF components comparison.
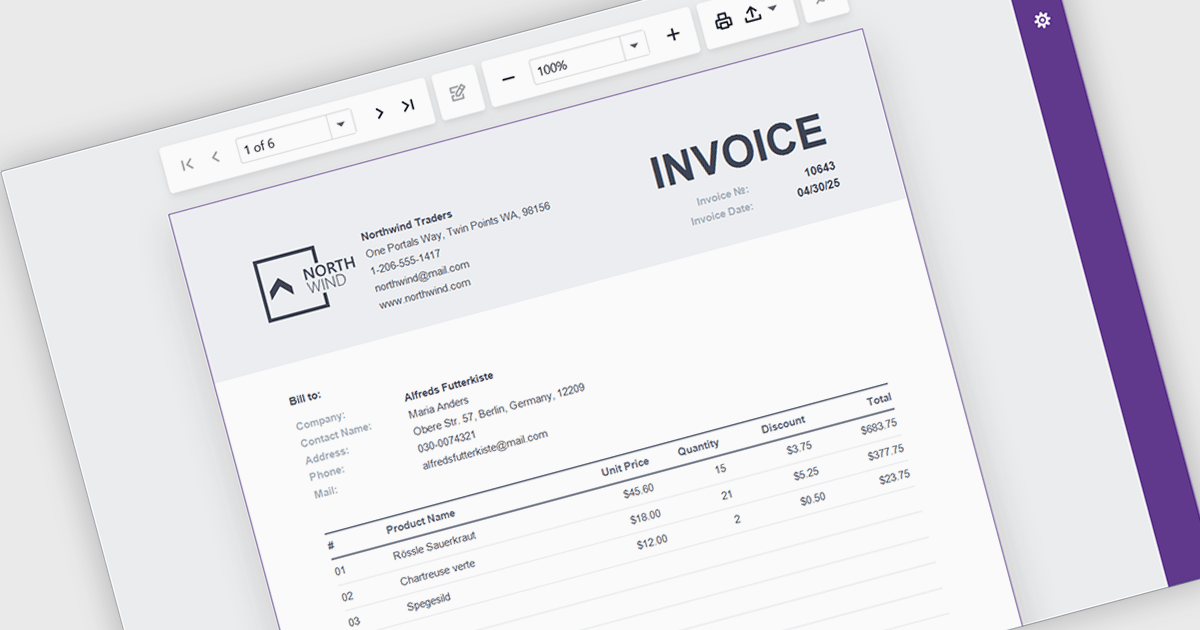
A report viewer is a UI element that renders and displays pre-built reports within a Blazor web application, allowing users to interact with them through features like pagination, parameter input, search, and export. It serves as the front-end interface for consuming reports generated by a reporting engine, often backed by data from databases or APIs. For developers, it enables seamless integration of reporting capabilities into Blazor applications without requiring page reloads or external viewers, supports responsive design for various devices, and maintains a consistent user experience through Blazor's component-based architecture.
Several Blazor Reporting Controls offer support for a report viewer including:
For an in-depth analysis of features and price, visit our comparison of Blazor Reporting Controls.
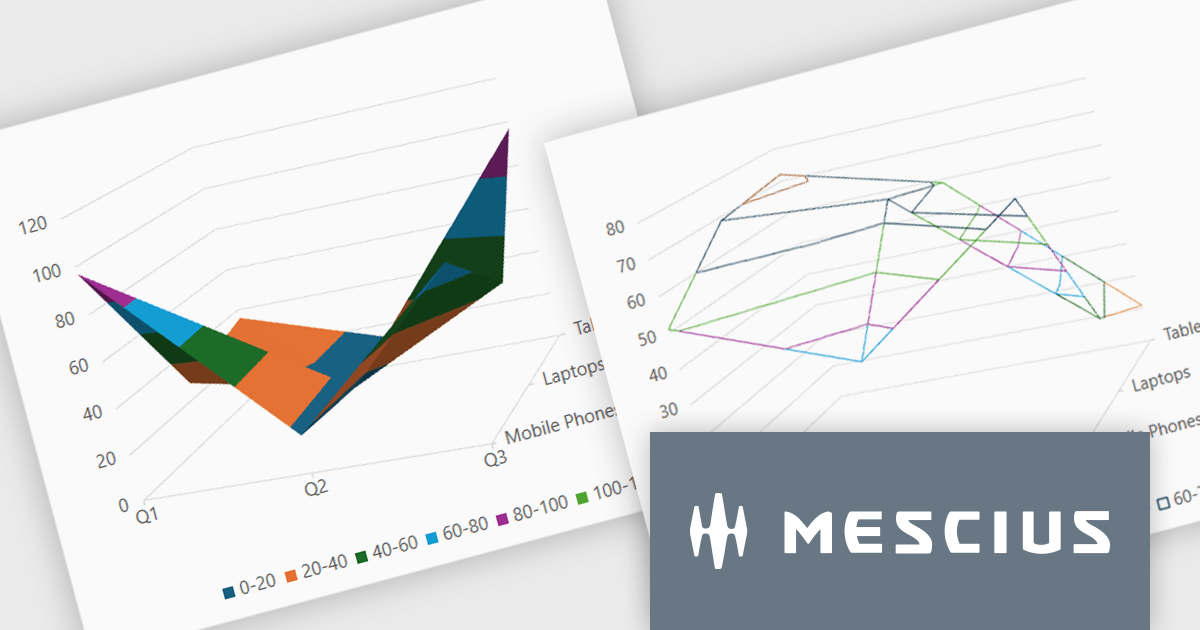
Spread.NET by MESCIUS is a powerful tool for building Excel-like applications in your .NET projects. It lets you create interactive spreadsheets, grids, dashboards, and even forms within WinForms, ASP.NET, and WPF applications. With its rich feature set, including a robust calculation engine, formula support, and Excel compatibility, Spread.NET empowers developers to build data analysis tools, budgeting apps, scientific dashboards, and more, all within the familiar .NET environment.
The Spread.NET v18.1 update introduces a new surface chart feature for WPF, providing developers with the capability to render spreadsheet data on a three-dimensional plane. By offering this advanced charting functionality, developers can create more sophisticated data visualization solutions within their WPF applications, allowing end-users to gain deeper insights into complex data and identify key correlations that may not be evident in two-dimensional representations. This feature expands the analytical tools available within Spread.NET, allowing for more nuanced and comprehensive data exploration.
To see a full list of what's new in v18.1, see our release notes.
Spread.NET is licensed per developer and is available as a Perpetual License with a 12 month support and maintenance subscription. We can supply any Spread.NET license including new licenses, maintenance renewals, and upgrade licenses. See our Spread.NET licensing page for full details.
For more information, visit our Spread.NET product page.
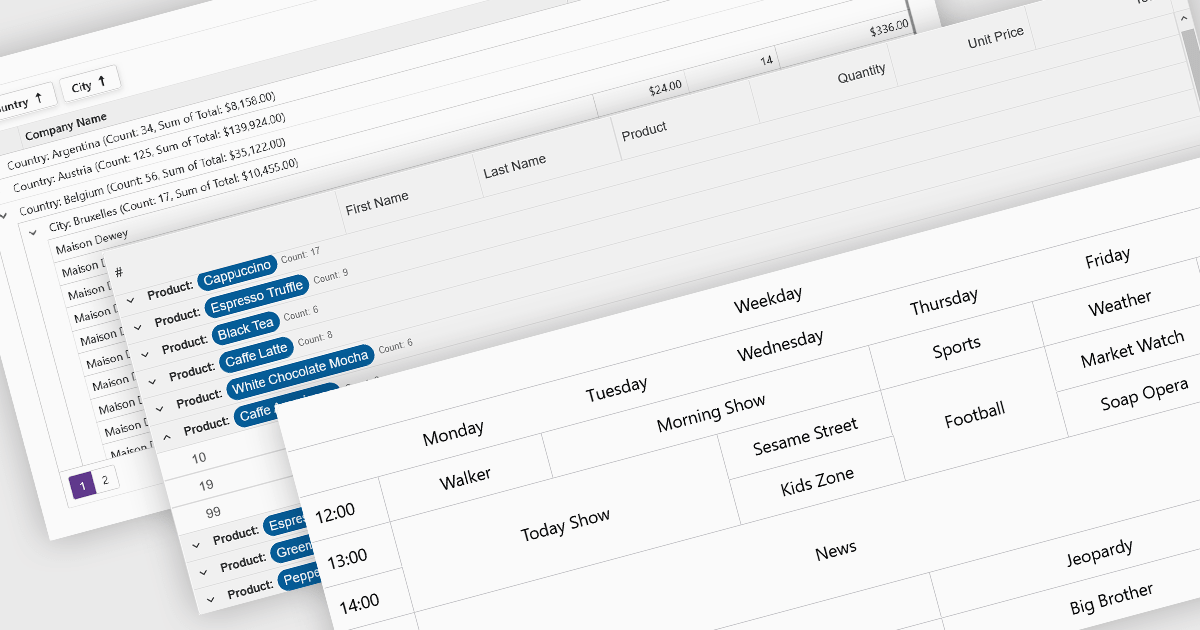
Data visualization and analysis features in grid components transform raw tabular data into structured, interpretable formats that support faster insights and decision-making. These features go beyond static display, offering dynamic ways to organize, summarize, and explore data directly within the grid interface, making it a powerful tool for both end-users and analysts.
Common features include:
For an in-depth analysis of features and price, visit our Blazor grid components comparison.
電話: (888) 850 9911
Fax: +1 770 250 6199


