


公式サプライヤー
公式および認定ディストリビューターとして200社以上の開発元から正規ライセンスを直接ご提供いたします。
当社のすべてのブランドをご覧ください。
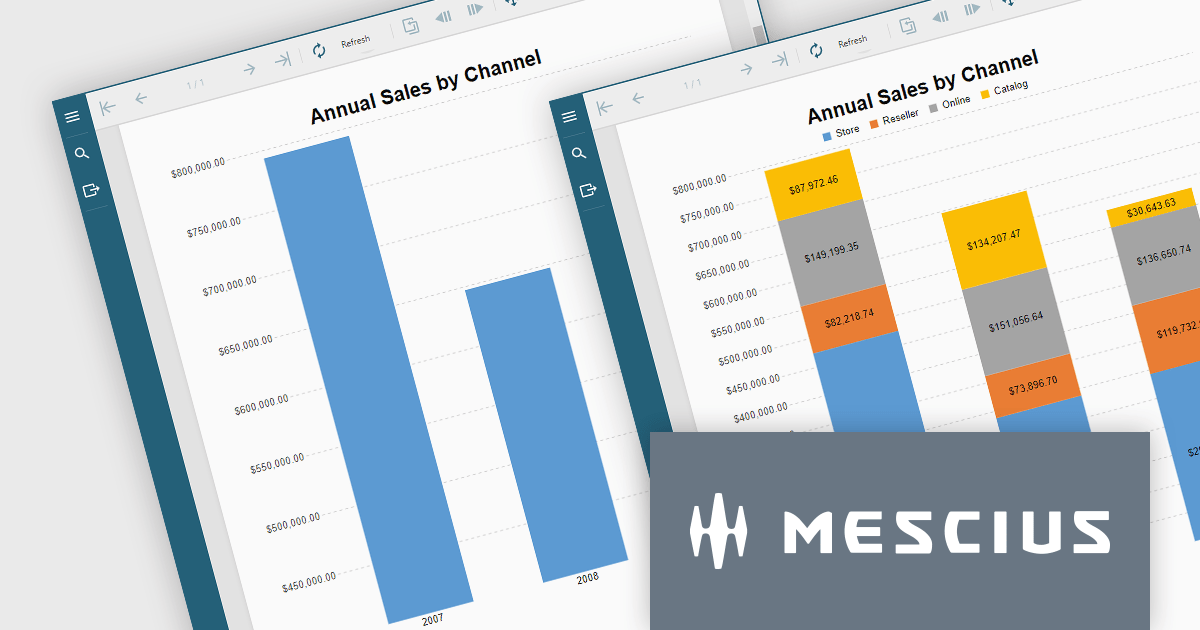
ActiveReportsJS is a reporting tool for web applications that allows developers and report authors to easily design and display reports within their applications. With a wide range of features, such as drill-down, runtime data filtering, and parameter-driven reports, as well as compatibility with popular frameworks, ActiveReportsJS simplifies the process of creating and managing reports.
In this blog post, MESCIUS Technical Engagement Engineer Joel Parks shows you how to utilize ActiveReportsJS to incoporate charts into your JavaScript report, and bind your chart data together through the use of parameterized drill-through navigation, allowing your users to easily traverse between them. Steps include:
Read the complete blog now, and start adding drill-through chart functionality to your JavaScript report using ActiveReportsJS.
ActiveReportsJS is licensed on an annual subscription or perpetual basis and is available as a Single Deployment License for non-commercial use, and as a Single Domain License or Unlimited Domain License for commercial and/or SaaS use. See our ActiveReportsJS licensing page for full details.
For more information, visit our ActiveReportsJS product page.
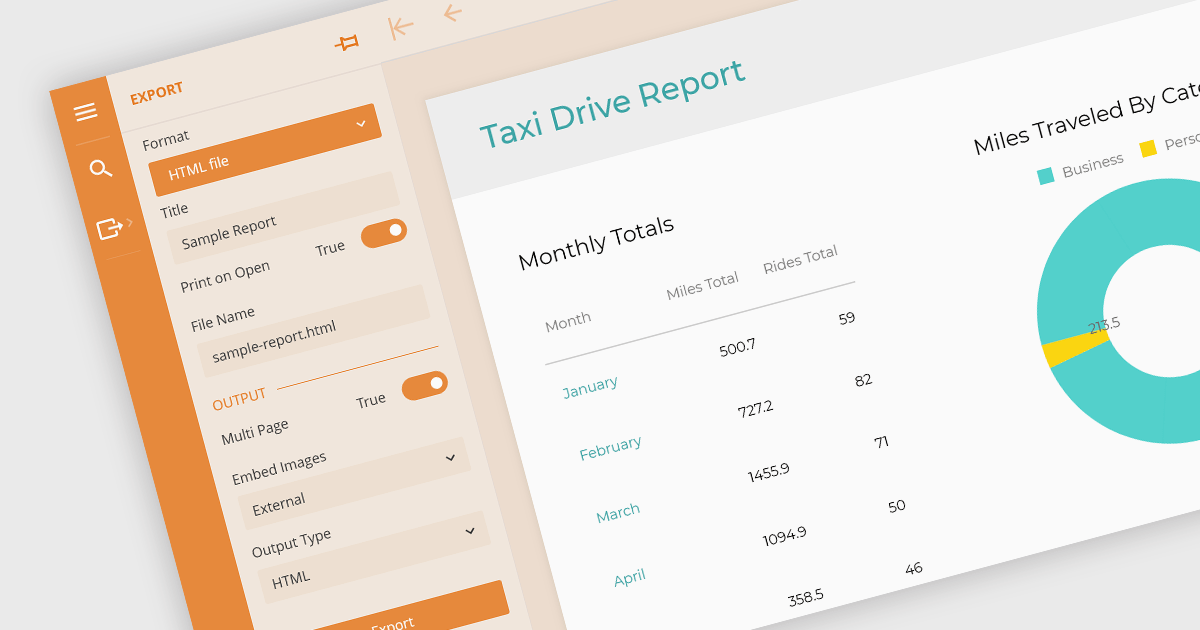
Being able to export to HTML is a valuable feature of a reporting application. Exporting reports to HTML files involves converting data visualizations and analytical summaries from a native format into web-friendly HTML pages. This allows for wider accessibility, sharing, and potentially embedding reports within websites. Static reports are transformed into interactive documents easily viewable on any device with a web browser. This format is ideal for sharing reports with collaborators, posting them online, or simply ensuring they remain accessible even if the original software becomes unavailable.
These Vue.js report components allow you to export reports to HTML files:
For an in-depth analysis of features and price, visit our comparison of Vue.js Reporting components.
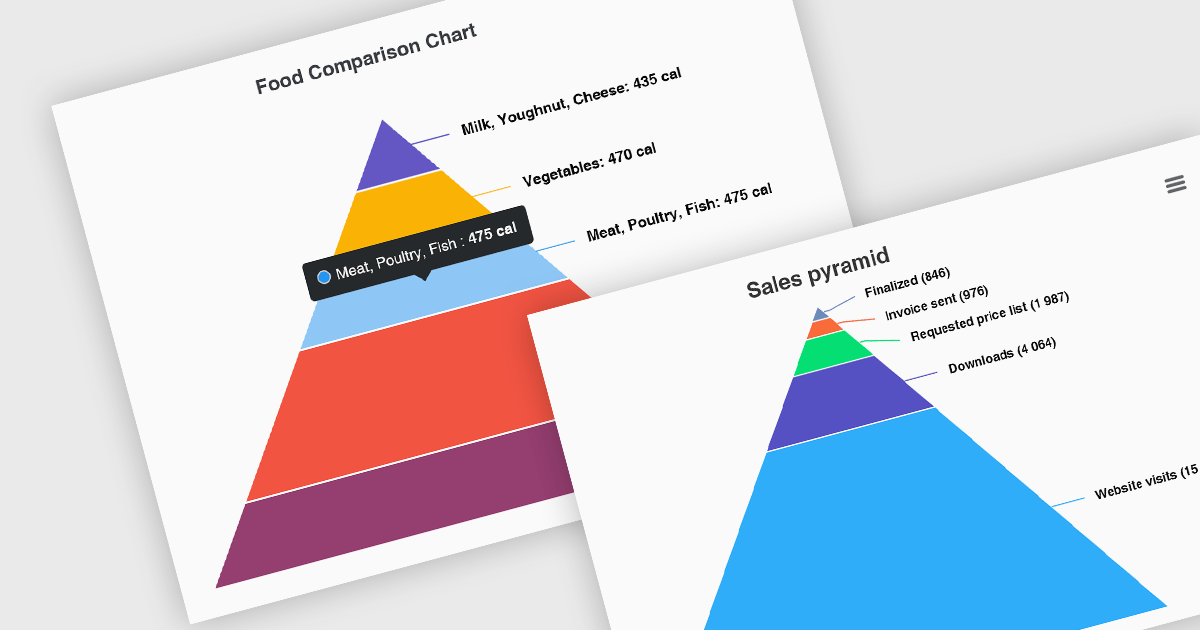
Pyramid charts, also known as triangle diagrams, utilize a triangular shape segmented into horizontal sections, each representing a level in a hierarchy, process, or simple dataset. Their strength lies in visually depicting hierarchical relationships, emphasizing the relative importance or size of each level through varying widths. The easily understood layout makes them ideal for communicating clear, singular data points in fields like sales funnels, population structures, and educational concepts.
Several Vue.js chart controls offer pyramid charts including:
For an in-depth analysis of features and price, visit our Vue.js chart controls comparison.

LightningChart JS is a high-performance JavaScript charting library that utilizes WebGL rendering and GPU acceleration to deliver exceptional performance for a wide range of data visualization needs. It is designed to handle large datasets and complex visualizations with ease, enabling developers to create interactive and visually appealing charts for various applications.
The LightningChart JS v5.1.0 release lets you unleash the power of complex visualizations with the new Mesh Model 3D chart type. Render intricate geometries and models with dynamic coloring pulled from a separate data set in real-time. The PaletteFill feature imbues 3D Mesh Models with vibrant colors based on vertex values, transforming your charts into captivating representations of even the most detailed 3D shapes.
To see a full list of what's new in v5.1.0, see our release notes.
LightningChart JS is licensed based on method of deployment with options including SaaS Developer Licenses, Application Developer Licenses, and Publisher Developer Licenses. Each license is perpetual and includes 1 year subscription for technical support and software updates. See our LightningChart JS licensing page for full details.
Learn more on our LightningChart JS product page.

ONLYOFFICE Docs is a comprehensive online editor, allowing users to create text documents, spreadsheets, presentations, and forms. It enables your users to edit, share, and collaborate on documents online in their preferred browser, within your own application. It's fully compatible with OOXML (Office Open XML) formats and supports popular Microsoft Office and other document formats such as CSV, DOC, DOCX, EPUB, HTML, ODP, ODS, ODT, PDF, PPT, PPTX, RTF, TXT, XLS, and XLSX.
The ONLYOFFICE Docs v8.0 update gives developers the ability to create complex, flexible forms with diverse field types and rich formatting options directly in familiar DOCXF templates. Collaborate seamlessly with colleagues and easily fill out forms from other applications, all within desktop and mobile apps. This major update caters to user feedback, promoting cross-platform compatibility and streamlined form integration for developers. Existing OFORM forms automatically convert to PDF upon opening in version 8.0.
To see a full list of what's new in v8.0.0, see our release notes.
ONLYOFFICE Docs is licensed by the number of simultaneous document connections and is available as an annual license with 1 year support and upgrades. See our ONLYOFFICE Docs licensing page for full details.
For more information, see our ONLYOFFICE Docs product page.
電話: (888) 850 9911
Fax: +1 770 250 6199


