


公式サプライヤー
公式および認定ディストリビューターとして200社以上の開発元から正規ライセンスを直接ご提供いたします。
当社のすべてのブランドをご覧ください。

PHP turns 31 this June, and JetBrains is marking it with PHPverse 2026—a free, live-streamed event focused on modern PHP and its future. This all-day event begins at 7:00 AM EDT (13:00 CET) on June 9th, 2026. This year’s lineup includes speakers like Jeffrey Way, Fabien Potencier, Jonathan Bossenger, and Elizabeth Barron. PHPverse gives you the opportunity to:
Join for the full day or just the sessions you care about.
Register now and mark your calendar for June 9th, 2026.
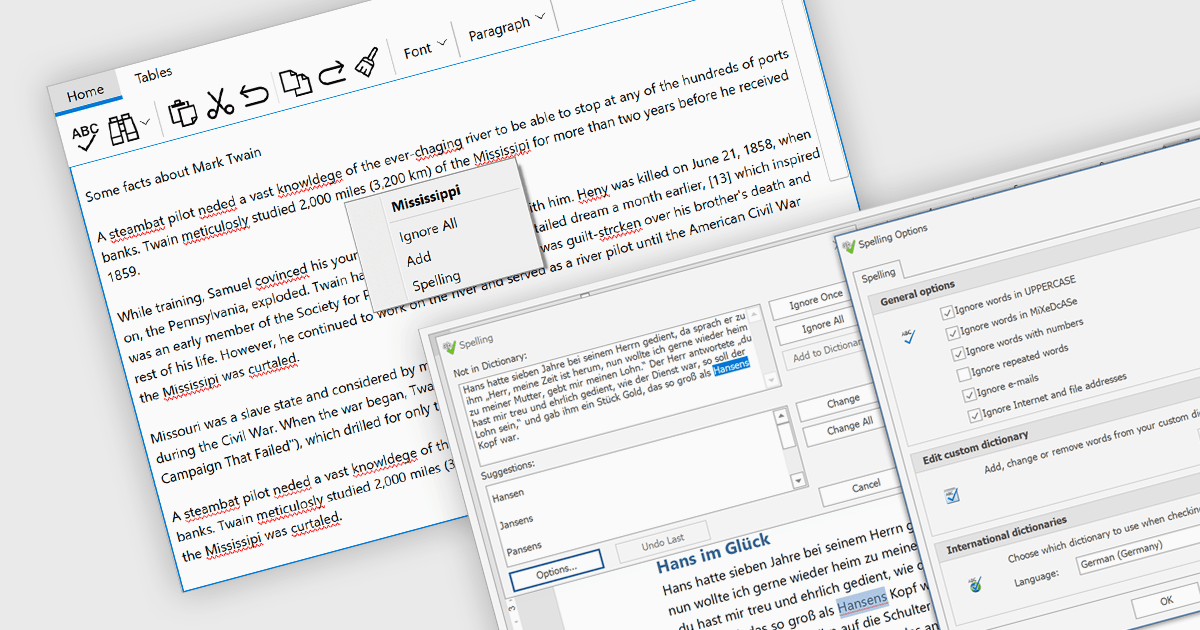
Spell checker components are reusable software modules that provide automated spelling validation within applications, typically integrated into text editors, data entry forms, or rich text controls. They use dictionaries and optional user-defined vocabularies to identify and suggest corrections for misspelled words, either in real time or during batch processing, with some implementations also incorporating language-specific rules. The primary benefits include improved data accuracy, enhanced user experience, and reduced manual proofreading effort, particularly in applications that rely heavily on text input such as document management systems, messaging tools, and reporting interfaces.
Several WinForms UI suites provide you with spell checker components, including:
For an in-depth analysis of features and price, visit our comparison of WinForms UI suites.
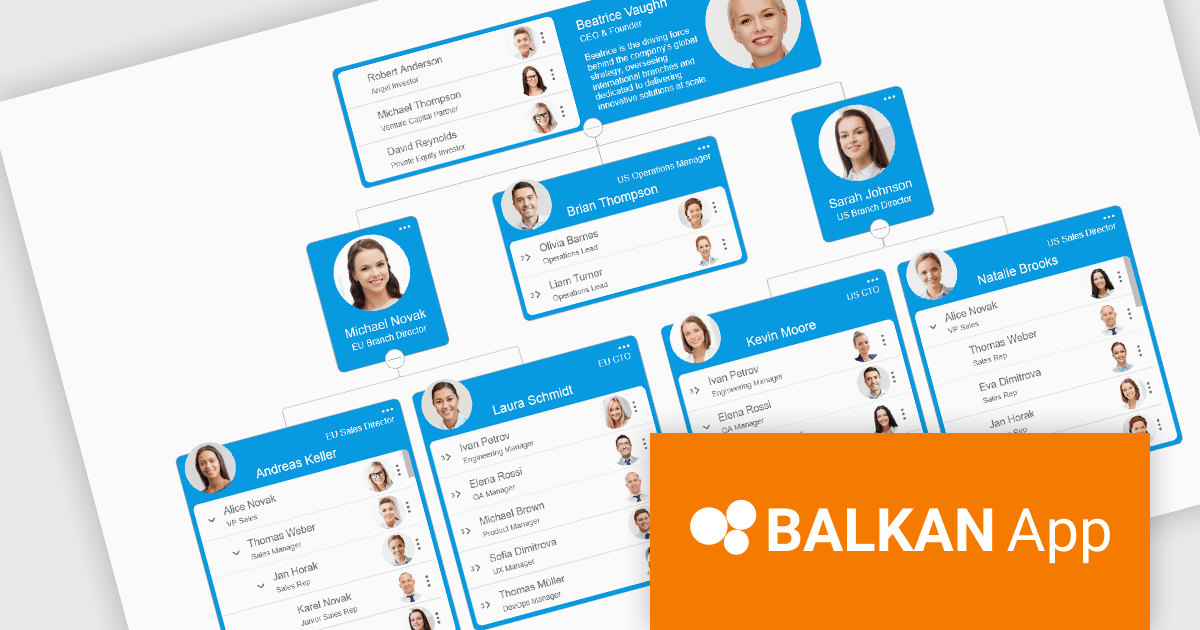
OrgChart JS by BALKAN App is a JavaScript library designed for creating flexible, interactive and customizable organizational charts for presenting structural data. This visual tool helps managers illustrate the roles and hierarchy of an organization, supporting a variety of features, including grouping, assistant nodes, expand/collapse, a built-in search field, and multi-format exports for example to PDF, PNG, SVG or CSV. Compatible with all modern browsers, it supports thousands of nodes without any impact on performance, and offers extensive customization, giving users a versatile and efficient tool for visualizing hierarchical data structures in web applications.
OrgChart JS includes the Tree List Layout, offering a space-efficient and readable way to represent hierarchical data by combining a tree structure with a linear list, enabling developers to display deeply nested hierarchies without the horizontal sprawl of traditional node-link diagrams. It allows nodes to be expanded and collapsed within a vertically aligned list, improving navigation and scalability while maintaining parent-child relationships, and supporting extensive nesting without compromising usability. This makes it particularly useful in scenarios with limited screen space or large datasets, where reducing visual complexity while preserving the full hierarchy is essential, such as administrative dashboards and data management interfaces.
OrgChart JS is licensed based on usage, offering single website, unlimited websites or SaaS, and OEM licenses. It is available as a perpetual license with 1 year maintenance and technical support. See our OrgChart JS licensing page for full details.
For more information, see our OrgChart JS product page.
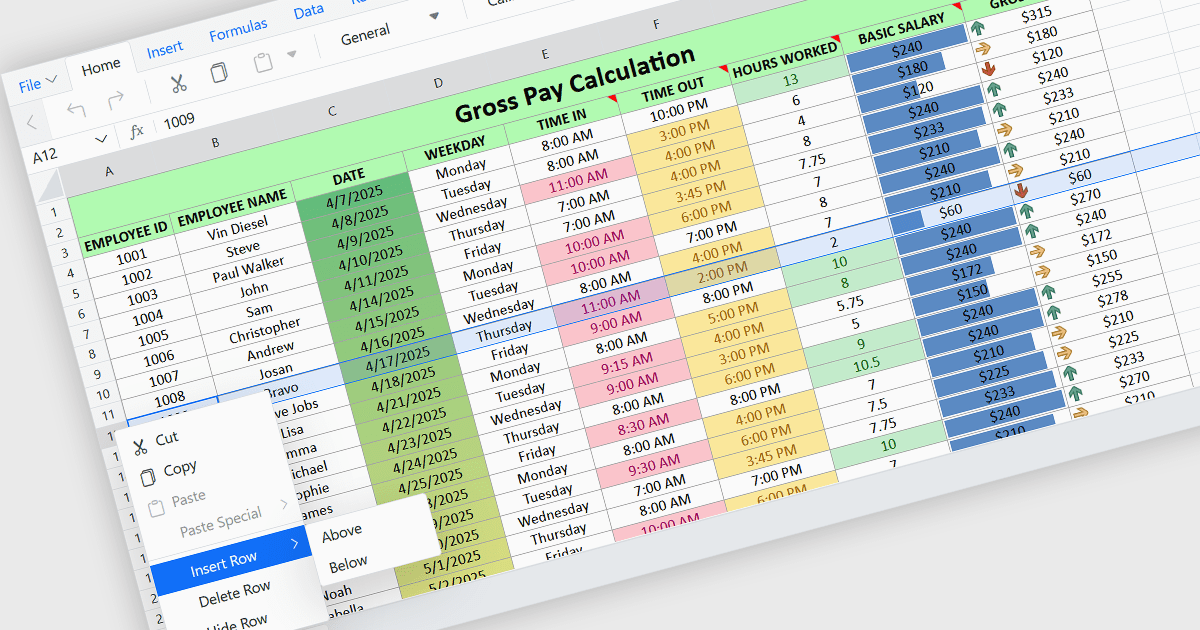
Inserting rows in spreadsheet components enables users to expand and reorganize data dynamically within a worksheet. It supports common data management tasks such as adding new records, adjusting layouts, and maintaining structured datasets without disrupting existing content. By integrating row insertion directly through APIs, applications can offer a familiar and efficient spreadsheet experience for users working with tabular data.
Several ASP.NET Core spreadsheet controls offer support for inserting rows including:
For an in-depth analysis of features and price, visit our ASP.NET Core spreadsheet controls comparison.
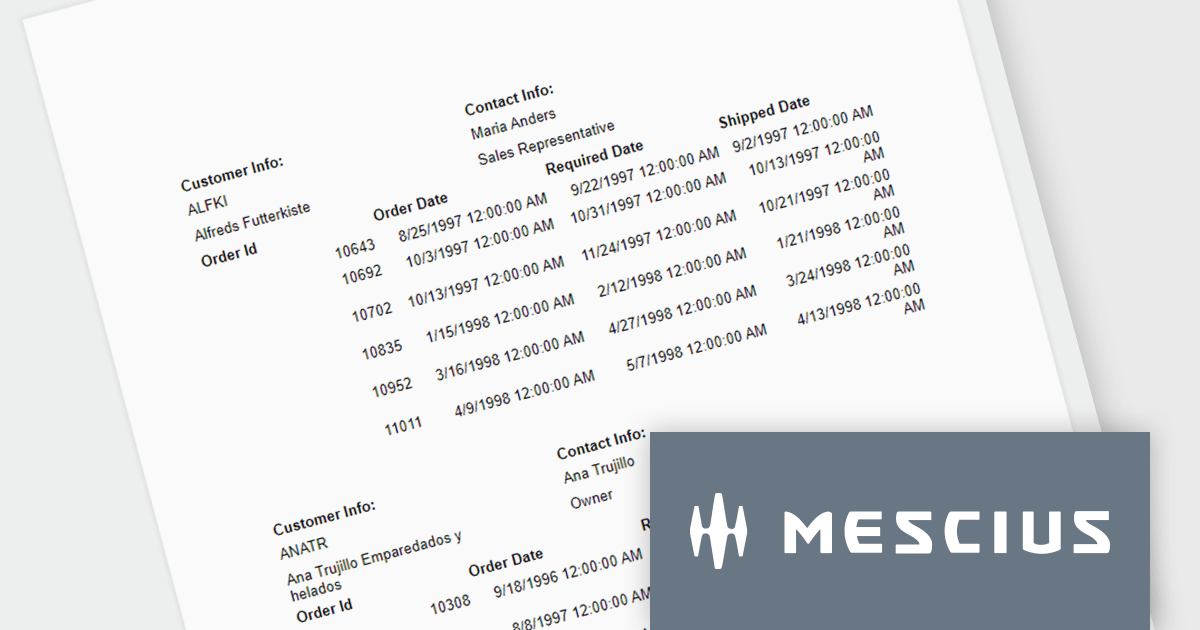
ActiveReportsJS is a powerful, lightweight reporting tool designed to integrate advanced reporting capabilities into any JavaScript application. ActiveReportsJS enables developers to create, view, export, and print richly formatted reports entirely on the client side - with zero server dependencies.
In this blog post, MESCIUS Product Consultant Victor Stahlman demonstrates how to build nested data regions in ActiveReportsJS to create master-detail reports that display related data, such as customers and their orders, within a structured layout. He walks your through configuring datasets, nesting controls like Lists and Tables, and applying filters to correctly link and present hierarchical data relationships in your reports. Key topics include:
By implementing nested data regions in ActiveReportsJS, you can transform flat datasets into structured, master-detail reports that are easier to read and analyze.
Read the complete blog to get started building scalable, dynamic JavaScript reports that deliver more meaningful insights to your users.
ActiveReportsJS is licensed on an annual subscription or perpetual basis and is available as a Single Deployment License for non-commercial use, and as a Single Domain License or Unlimited Domain License for commercial and/or SaaS use. See our ActiveReportsJS licensing page for full details.
For more information, visit our ActiveReportsJS product page.
電話: (888) 850 9911
Fax: +1 770 250 6199


