


公式サプライヤー
公式および認定ディストリビューターとして200社以上の開発元から正規ライセンスを直接ご提供いたします。
当社のすべてのブランドをご覧ください。
CodeRush Ultimate is a Visual Studio extension designed to improve developer productivity and creativity. It empowers you to generate sophisticated code, automate tedious tasks, and navigate your codebase effortlessly, all while boosting code quality and readability. By eliminating repetitive coding and providing intelligent assistance, CodeRush Ultimate frees you to focus on the big picture, helping you deliver more features faster and with higher quality.
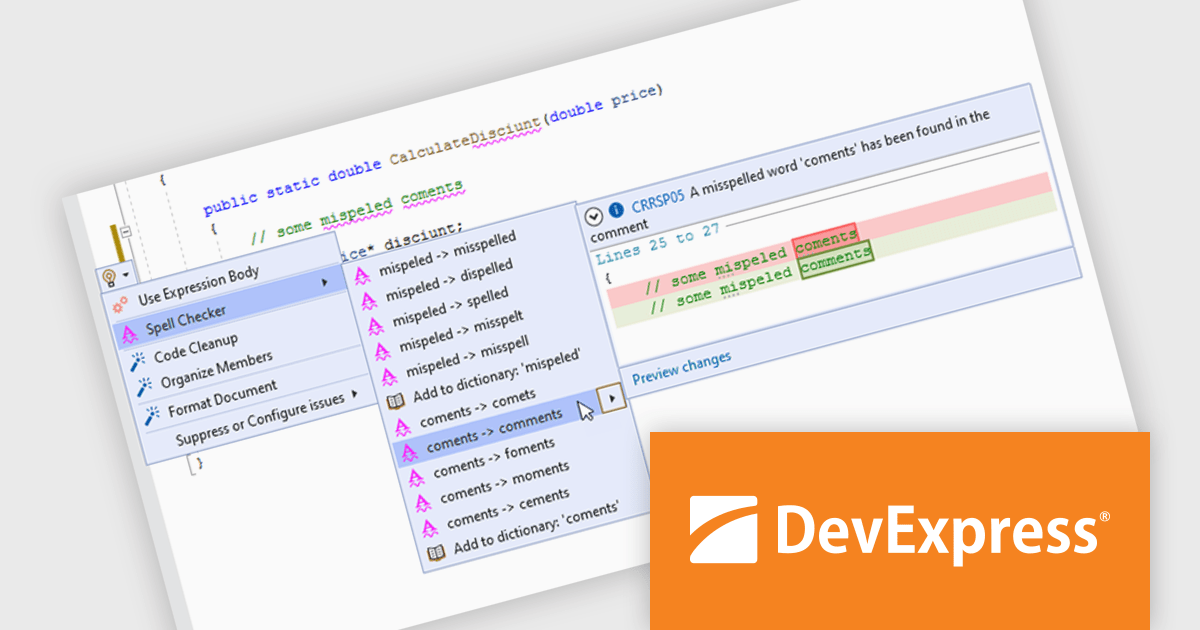
CodeRush optimizes code visualization and readability by improving structure, clarity, and maintainability within Visual Studio. It helps developers quickly identify and correct misspellings in code, comments, and strings, ensuring accuracy and professionalism. In-place expression value previews streamline debugging by allowing immediate verification of values without disrupting workflow. Code block and region highlighting improve navigation and comprehension, while a right margin indicator helps maintain consistent formatting for better readability across different screen sizes. By simplifying code interaction and improving visual structure, CodeRush enables developers to write, review, and debug code more efficiently.
CodeRush Ultimate is licensed per developer and is available as a Perpetual License with a 12 month support and maintenance subscription. See our CodeRush Ultimate licensing page for full details.
CodeRush Ultimate is available to buy in the following products:
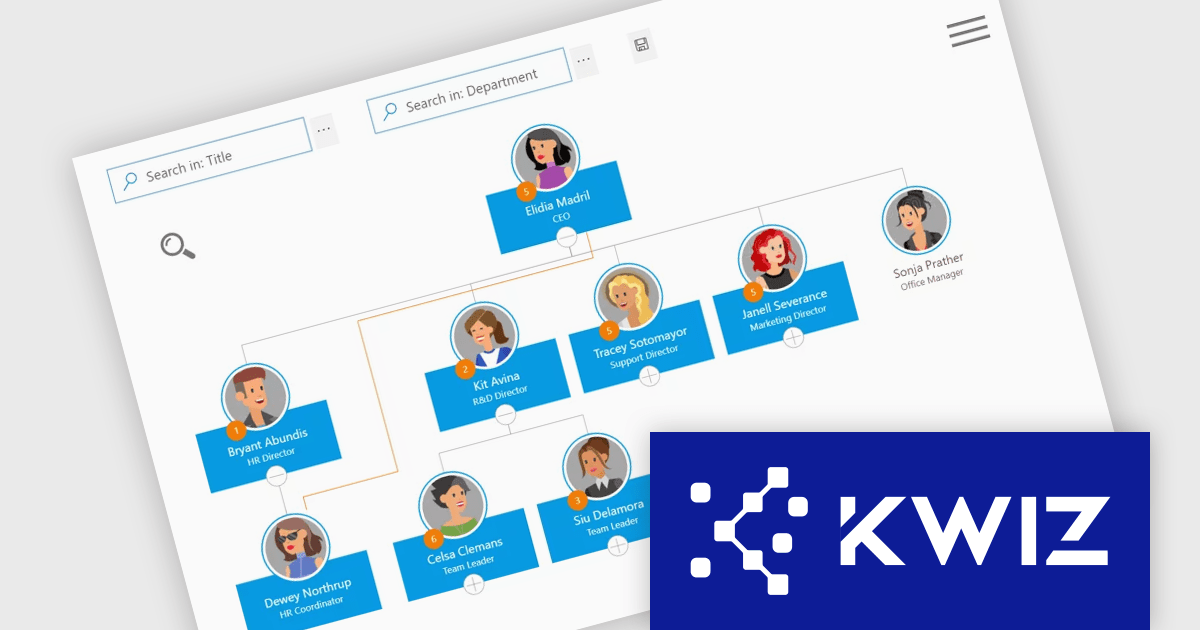
KWIZ Organization Chart enhances organizational management by integrating data from various sources to display dynamic breakdown structures in tree, grid, or custom views. Unlike static charts, KWIZ offers real-time, interactive visuals with a user-friendly interface for easy customization. Users can quickly locate and connect with colleagues, enhancing accessibility and collaboration. Ideal for HR and management teams, it provides clear insights and fosters efficiency across the organization.
The KWIZ Org Chart boosts data accessibility and usability by allowing software developers to implement personalized custom filters and formatting, enabling precise searches and tailored data visualizations. This feature empowers users to create logic-based conditions to dynamically highlight specific employees or attributes using icons, colors, and other visual cues. By integrating these capabilities, developers can deliver highly customizable, user-friendly tools that adapt to diverse organizational needs, streamline workflows, and provide actionable insights in real time.
KWIZ Organization Chart is licensed on an annual basis, requiring each user in your organization to be covered by an Annual Subscription license. Different levels are available to cater for different numbers of users. See our KWIZ Organization Chart licensing page for full details.
For more information, visit our KWIZ Organization Chart product page.
Stimulsoft BI Designer is a powerful reporting tool designed to create visually appealing and interactive reports. It empowers users to design and develop complex reports with ease, integrating data from various sources and presenting it in a clear, concise, and informative manner. With its rich feature set, Stimulsoft BI Designer is widely used in diverse industries, including finance, healthcare, retail, and manufacturing, to generate reports for analysis, decision-making, and compliance purposes. Key benefits include its intuitive interface, extensive customization options, and support for multiple data sources, making it an essential tool for organizations seeking to enhance their reporting capabilities and gain valuable insights from their data.
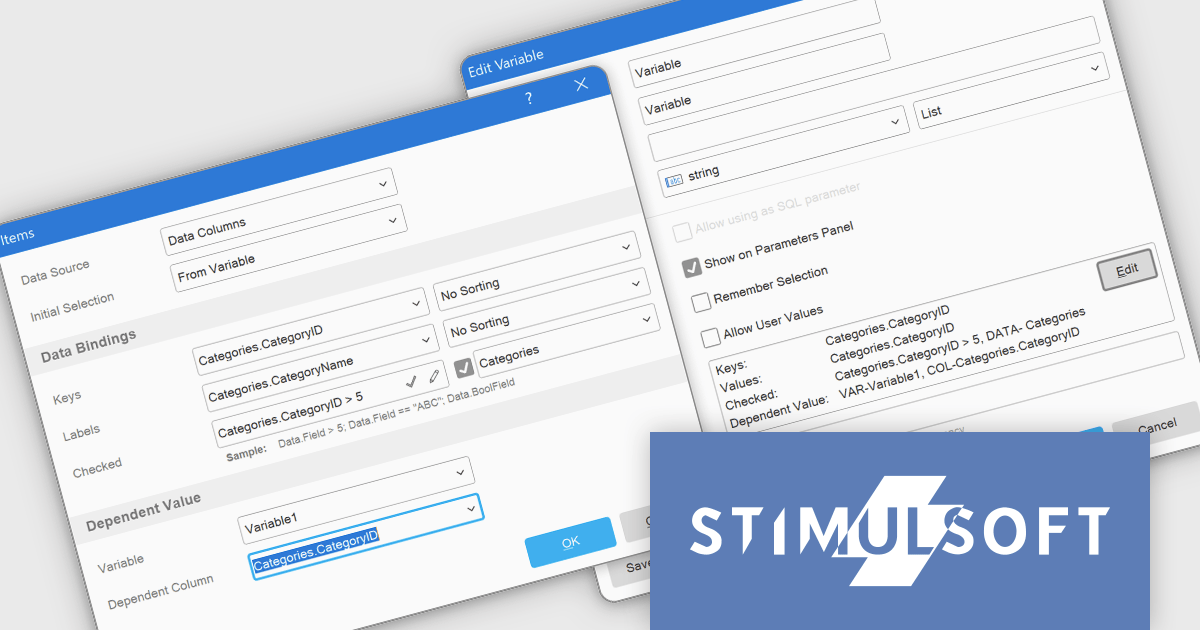
The Stimulsoft BI Designer 2025.1.1 update introduces an optimized variable editor that enhances the process of creating and managing report variables. This improvement streamlines parameter configuration by moving it to a dedicated window, offering developers a more organized and efficient workspace. The ability to enable the "Show on parameter panel" option and directly edit variable elements in the Items field simplifies customization, making it faster and more precise. By reducing complexity and improving usability, this update enables developers to create and adjust reports with greater efficiency and control, supporting more dynamic and tailored reporting solutions.
To see a full list of what's new in 2025.1.1, see our release notes.
Stimulsoft BI Designer is available as a perpetual license and is licensed per creator. A creator has an account on the server, has access from the client-side, registered as an editor, and uses the product to work with report templates and dashboards - create, edit, view, delete, etc. See our Stimulsoft BI Designer licensing page for full details.
Stimulsoft BI Designer is available individually or as part of Stimulsoft Ultimate.
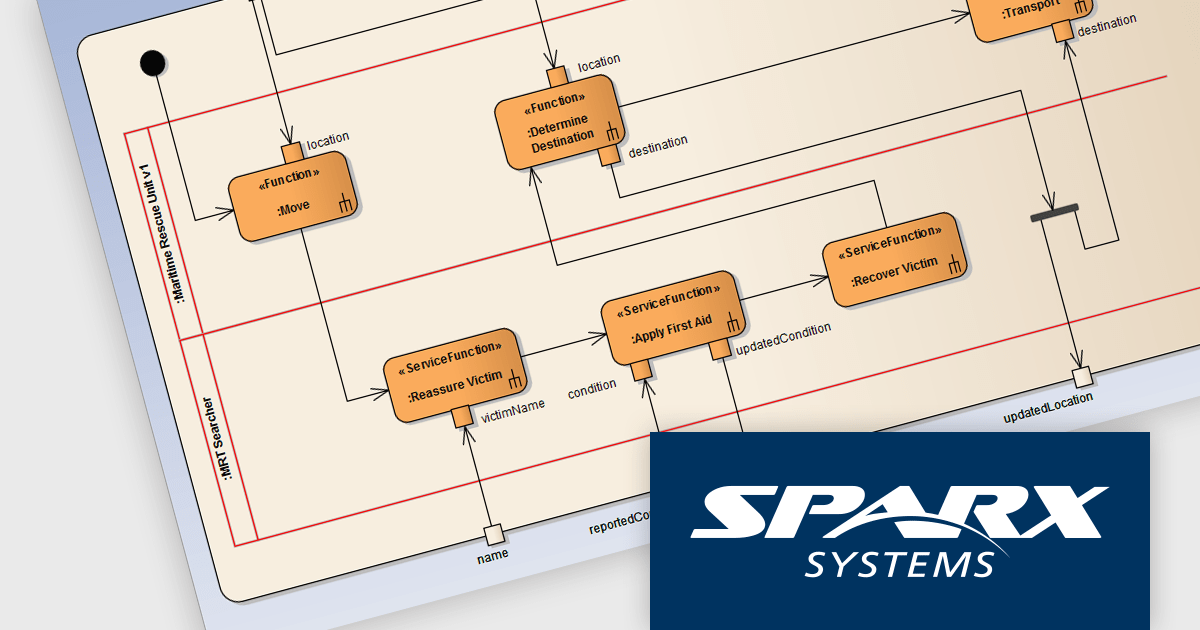
Pro Cloud Server by Sparx Systems is an enterprise-level solution designed to enhance collaboration, accessibility, and integration for teams using Enterprise Architect. It provides secure, web-based access to models, enabling real-time collaboration and seamless interaction with third-party tools via OSLC (Open Services for Lifecycle Collaboration), RESTful APIs, and cloud-based services. With features such as WebEA for browser-based model access, automated updates, version control, and improved performance for remote teams, Pro Cloud Server streamlines model management while reducing IT overhead. It is an essential tool for organizations seeking efficient, scalable, and interconnected model-driven development and system engineering workflows.
The Pro Cloud Server 6.0 update introduced significant enhancements to its OSLC capabilities, improving interoperability, model management, and external integrations. It now fully supports creating all elements from imported MDG Technologies, allowing for seamless use of custom modeling frameworks within OSLC interactions. Additionally, it enables OSLC consumers to retrieve diagram snapshots dynamically, enhancing visualization and historical tracking of model diagrams. Performance improvements in bulk synchronization reduce latency when updating and managing large-scale model repositories, while strengthened OSLC connectivity with third-party tools enables smoother data exchange and real-time collaboration. These advancements make Pro Cloud Server 6.0 a more powerful solution for enterprise-wide modeling and lifecycle management.
Pro Cloud Server is licensed annually and must be renewed each year to continue using the software. It is available in Team Server, Enterprise, and Token licensing options, offering flexibility for organizations of various sizes. Typically licensed per server, it may also require additional user-based or connection-based licensing, depending on the edition and functionality required . See our Pro Cloud Server licensing page for full details.
Learn more on our Pro Cloud Server product page.

Modern spreadsheet components bring the power of Excel-like functionality to web applications, enabling users to create, edit, and manipulate data within an interactive grid. These components typically support formulas, formatting, data validation, and seamless integration with various data sources. Advanced features such as pivot tables, conditional formatting, and charting allow users to analyze and visualize data efficiently. Designed for performance and scalability, these spreadsheet controls cater to both enterprise applications and smaller projects that require robust data processing capabilities.
Several ASP.NET Core UI suites offer spreadsheet components including:
For an in-depth analysis of features and price, visit our ASP.NET Core UI suites comparison.
電話: (888) 850 9911
Fax: +1 770 250 6199


