


公式サプライヤー
公式および認定ディストリビューターとして200社以上の開発元から正規ライセンスを直接ご提供いたします。
当社のすべてのブランドをご覧ください。
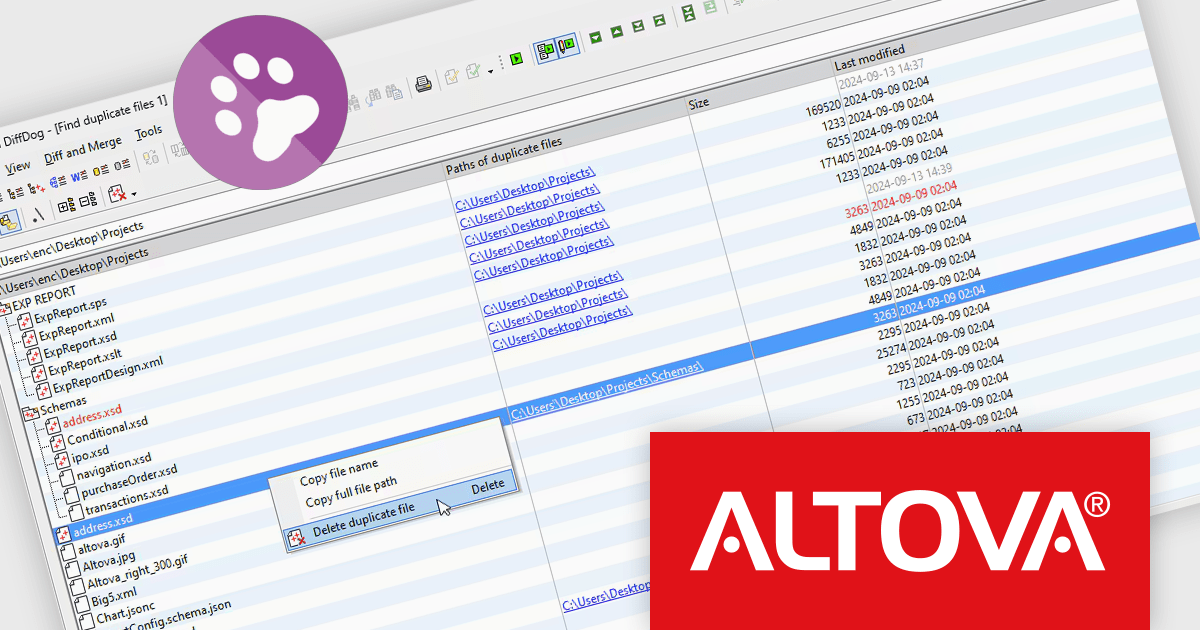
Altova DiffDog is a robust tool for comparing and synchronizing files, databases, and directories, offering a comprehensive solution for efficient data management. It supports a wide range of file types and complex data structures, ensuring precision in comparison and synchronization processes. DiffDog helps streamline data organization, minimize redundancy, and maintain clean, reliable data environments, making it an invaluable asset for managing expanding directories and ensuring data integrity.
The DiffDog 2025 release introduces enhanced capabilities, including advanced duplicate file detection across folders and subfolders, helping users save storage, reduce redundancy, and maintain data integrity. Common use cases include streamlining backups, optimizing storage in shared directories, and ensuring accurate version control across development environments. These updates make DiffDog 2025 an essential tool for efficient, organized, and reliable data management.
To see a full list of what's new in version 2025, see our release notes.
Altova DiffDog is licensed per Installed, Concurrent or Named user. Licenses are perpetual, and come with or without 1 year Support and Maintenance Package (SMP). See our Altova DiffDog licensing page for full details.
Altova DiffDog is available to buy in the following products:
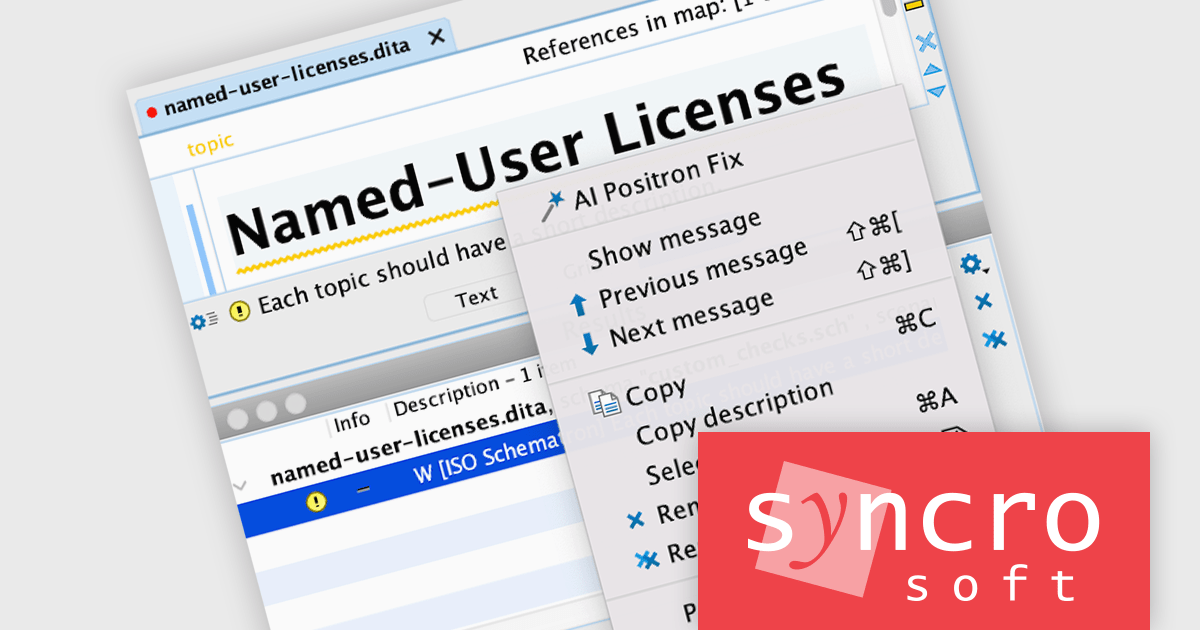
The Oxygen AI Positron Assistant Enterprise Plug-in by Syncro Soft is an Artificial Intelligence powered extension for the Oxygen XML editing suite designed specifically for technical writers. It leverages OpenAI, Microsoft Azure OpenAI Service, or Anthropic Claude to automate repetitive tasks, improve content structure and flow, and generate draft text based on user prompts. The plugin integrates seamlessly within the Oxygen environment, offering visual comparisons of suggested changes and allowing developers to control the creative process through ongoing prompts and revisions.
The Oxygen AI Positron Assistant Enterprise V4.0 release improves the AI Positron Fix action by leveraging the Retrieval-Augmented Generation (RAG) process to enhance the AI's response by using information from the current document, leading to more relevant responses for users.
To see a full list of what's new in V4.0, see our release notes.
Oxygen AI Positron Assistant Enterprise is licensed per Named user and is available as a Timed License with support and maintenance subscription. See our Oxygen AI Positron Assistant Enterprise licensing page for full details.
Learn more on our Oxygen AI Positron Assistant Enterprise product page.
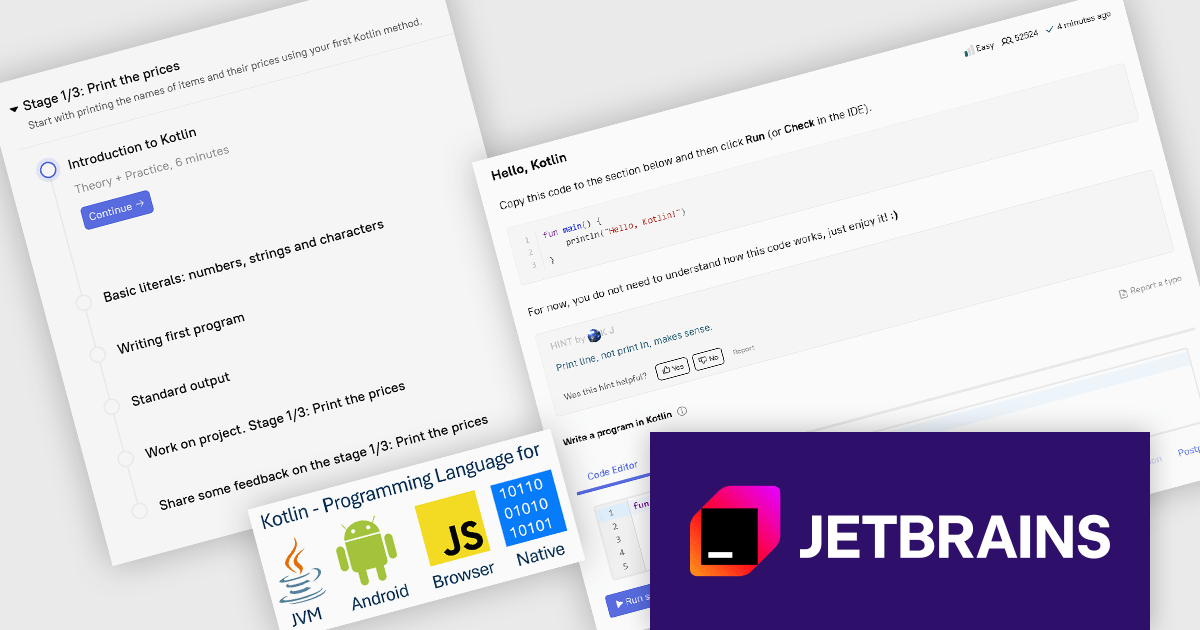
JetBrains Academy is an online educational platform designed to help developers advance their programming skills. It provides a holistic approach to learning in which users study the theory and immediately put it into practice by building working applications. The project-based learning environment is integrated with JetBrains IDEs, and allows developers to learn Java, Python, and other programming languages with ease.
The JetBrains Academy November 2024 update introduces a new Kotlin project that simplifies programming with an intuitive syntax and enhanced safety features, making it ideal for beginners and efficient for experienced developers. This project supports seamless integration with Java, enabling both standalone Kotlin projects and hybrid development within existing Java codebases. Designed for versatile applications across Android, web, and multiplatform environments, Kotlin’s latest enhancements promote faster, more reliable development, making it a powerful tool for a wide range of coding needs.
To see a full list of what's new, see our release notes.
JetBrains Academy is licensed per user as a commercial annual subscription. See our JetBrains Academy for Organizations licensing page for full details.
For more information, visit our JetBrains Academy for Organizations product page.
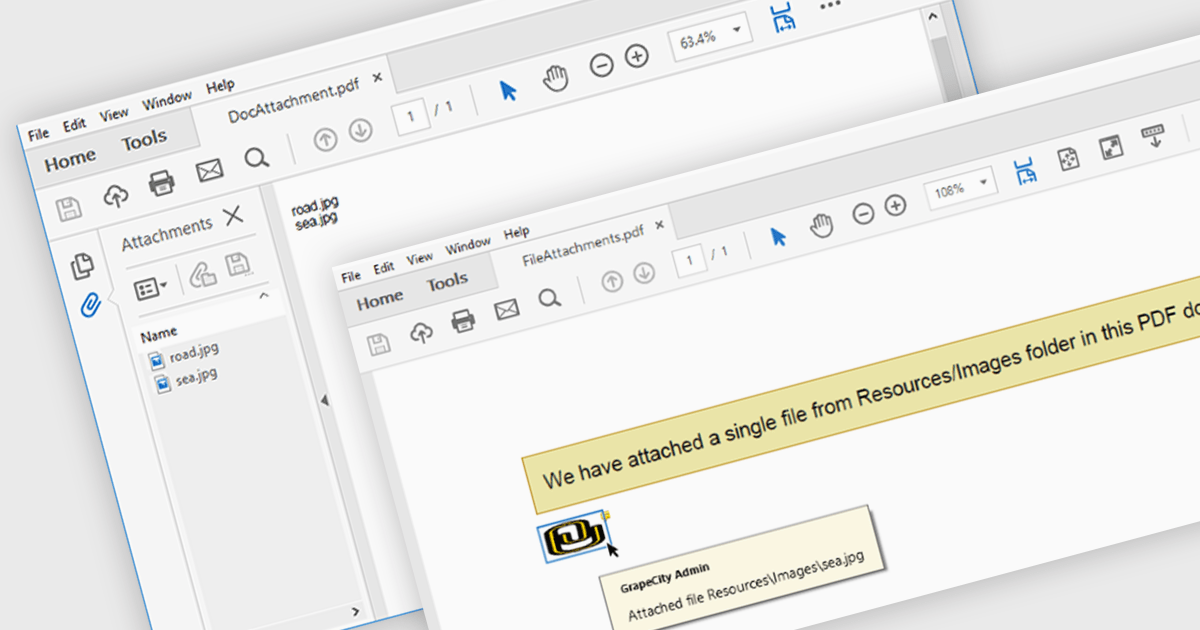
The ability to attach files to a PDF enables seamless integration of supplementary documents directly into the primary PDF file. This functionality streamlines workflows by consolidating related materials into a single, easily accessible package. Developers can leverage this feature to enhance document organization, improve collaboration, and provide a more comprehensive user experience.
Several .NET PDF components offer support for attaching files to a PDF including:
For an in-depth analysis of features and price, visit our comparison of .NET PDF components.
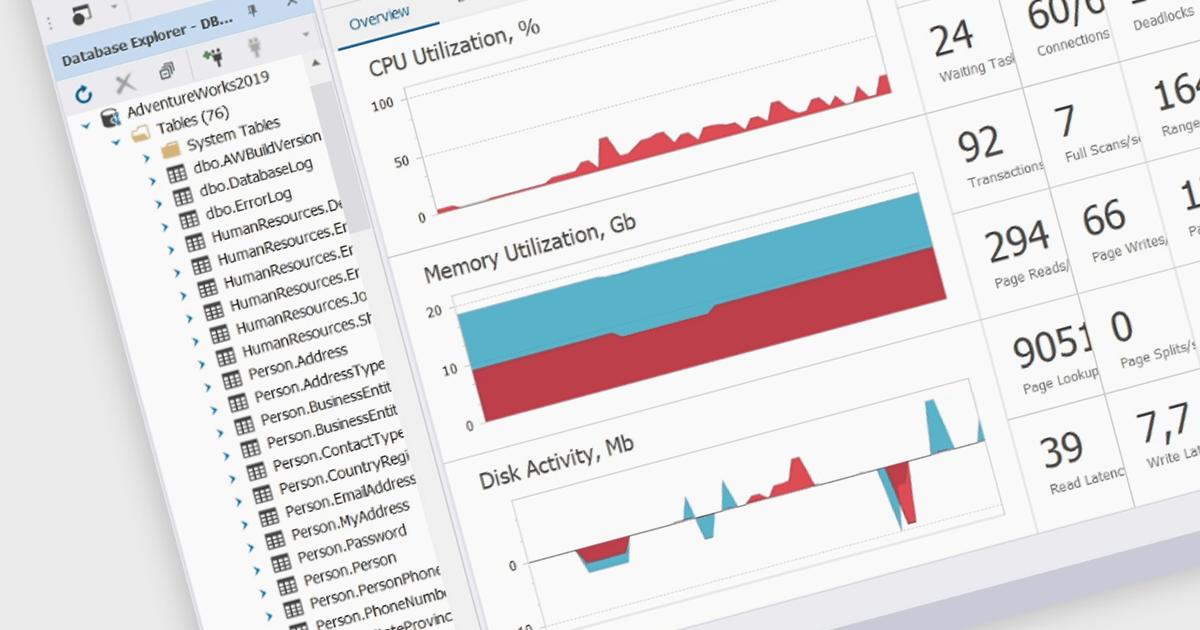
Real-time database monitoring is the continuous process of tracking and analyzing database activity, performance, and security events as they happen, enabling immediate detection of issues, anomalies, and unauthorized access, which supports proactive database management and optimization. Monitor key performance indicators (KPIs) in real-time, such as CPU usage, memory consumption, disk I/O, network traffic, and query execution time.
Several Database Administration applications support real-time database monitoring including:
Explore our Database Administration Applications
電話: (888) 850 9911
Fax: +1 770 250 6199


