


公式サプライヤー
公式および認定ディストリビューターとして200社以上の開発元から正規ライセンスを直接ご提供いたします。
当社のすべてのブランドをご覧ください。
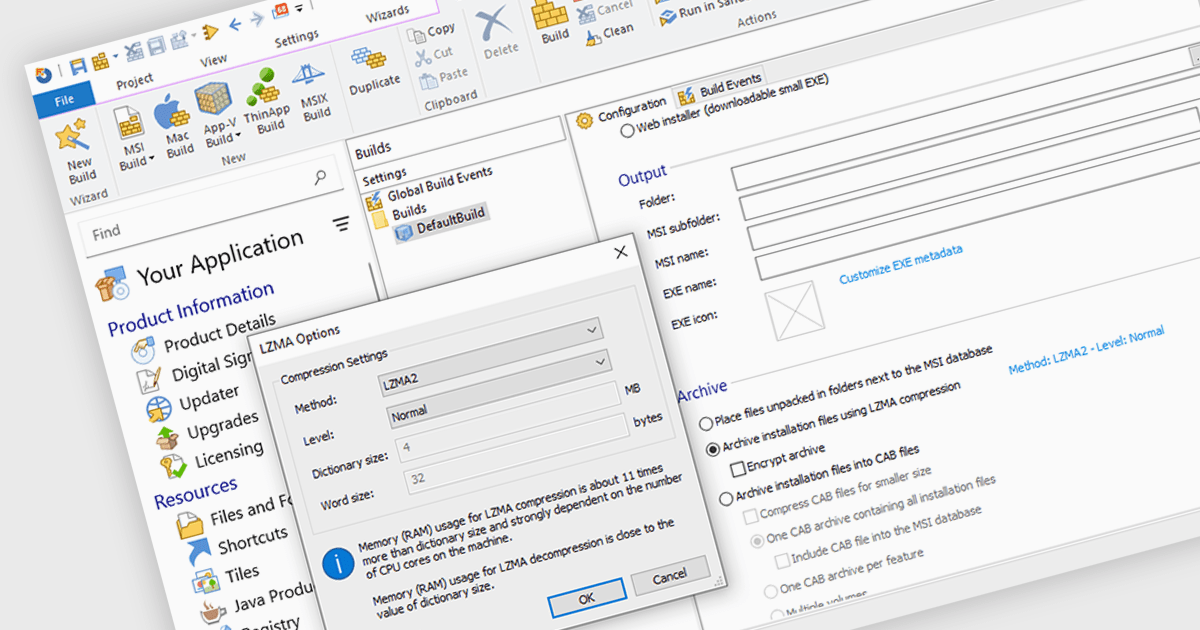
Data compression is a critical component of modern installation tools, enabling efficient delivery and reduced storage requirements. By reducing file sizes, compression accelerates download times, minimizes network bandwidth consumption, and optimizes installation package storage. Advanced compression algorithms specifically designed for software installation packages further enhance performance, ensuring swift and reliable deployment while preserving data integrity.
Several installation tools offer data compression including:
For an in-depth analysis of features and price, visit our comparison of Installation Tools.
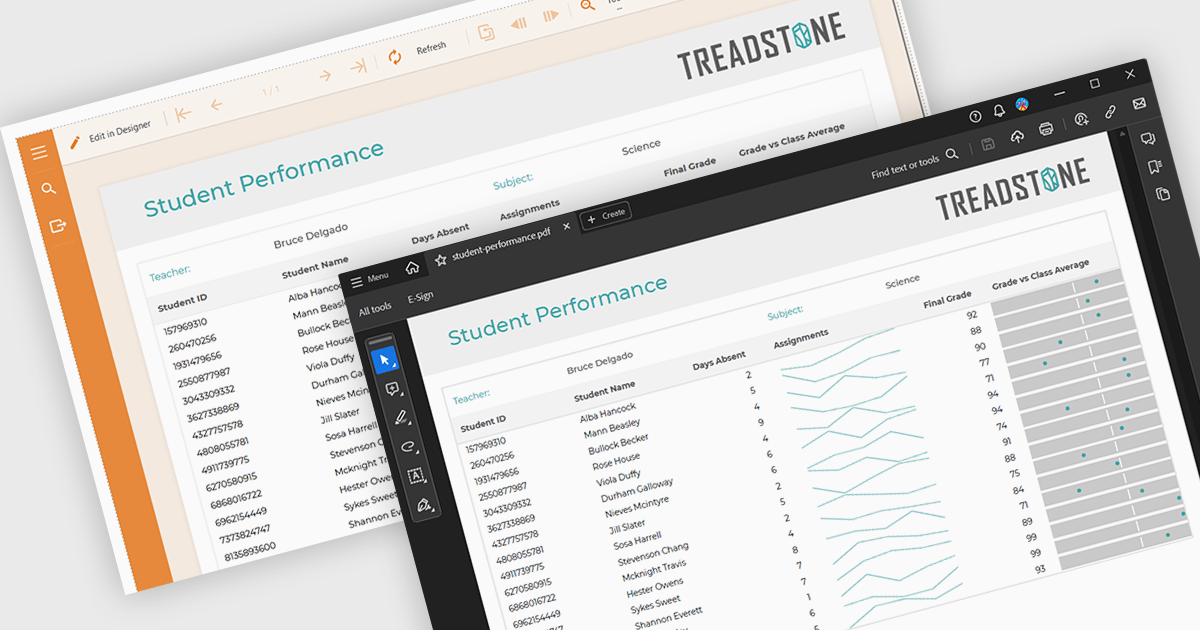
PDF export functionality within a reporting component enables the transformation of generated report data into a portable, high-fidelity PDF document. This capability offers significant advantages, including standardized document format compatibility, enhanced security through encryption options, optimized file size for efficient storage and transmission, and preservation of complex layout and formatting, ensuring consistent visual representation across different platforms and devices.
Several Angular reporting components offer PDF export support including:
For an in-depth analysis of features and price, visit Angular reporting components comparison.
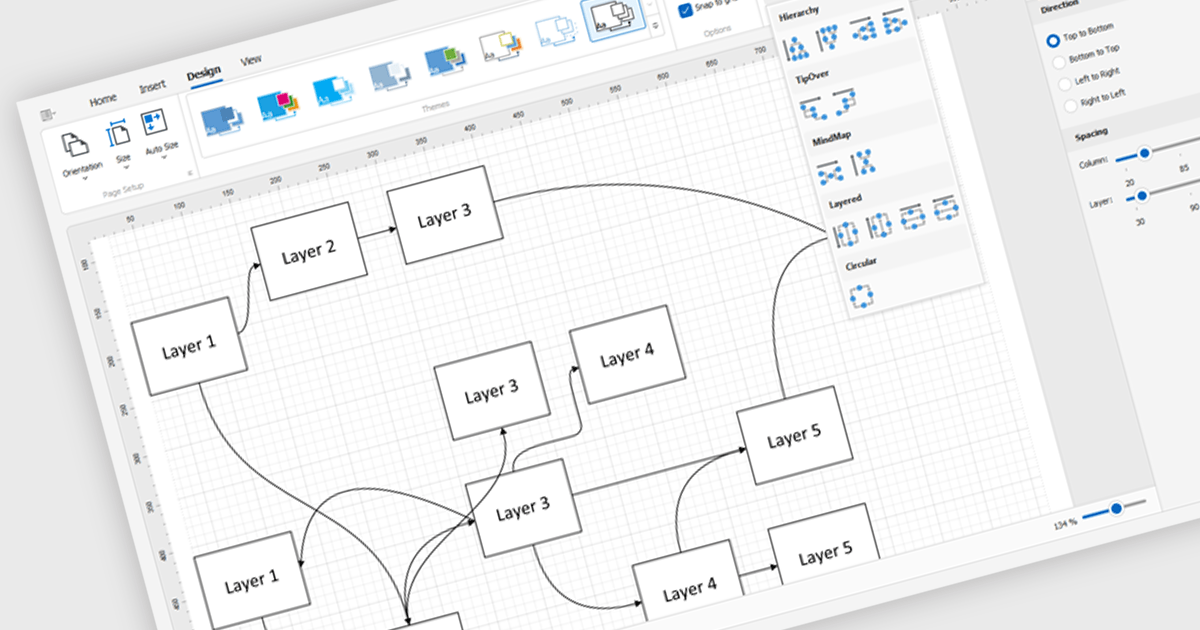
Diagram controls provide pre-built graphical elements for constructing various diagrams, flowcharts, and organizational charts within applications. These components accelerate development by offering customizable shapes, connectors, layouts, and interaction features, enabling developers to rapidly create visually appealing and interactive diagrams without extensive manual coding, thereby enhancing user experience and application functionality.
Many .NET WinForms UI Suite collections contain diagram controls including:
For an in-depth analysis of features and price, visit our comparison of .NET WinForms UI Suites.
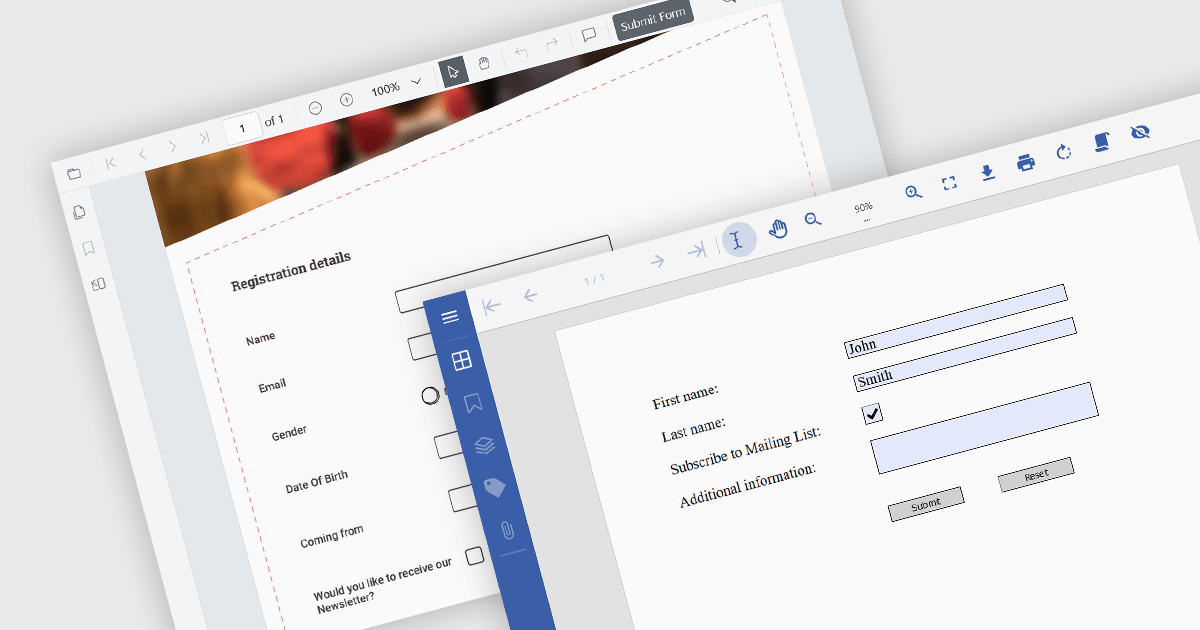
A submit action within a PDF form is a designated button or field that, when activated, sends the completed form data in a structured format, like FDF, XFDF, HTML, or PDF to a specified destination, such as a web server, email address, or database. This action streamlines data collection and processing, enabling quick and efficient transmission of information without requiring the user to manually extract or send the data. It enhances the usability of PDF forms, particularly in scenarios where timely data submission is crucial, such as in online applications, surveys, or order forms.
Several .NET PDF viewer components allow you to submit a PDF form, including:
For an in-depth analysis of features and price, visit our comparison of .NET PDF viewer components.
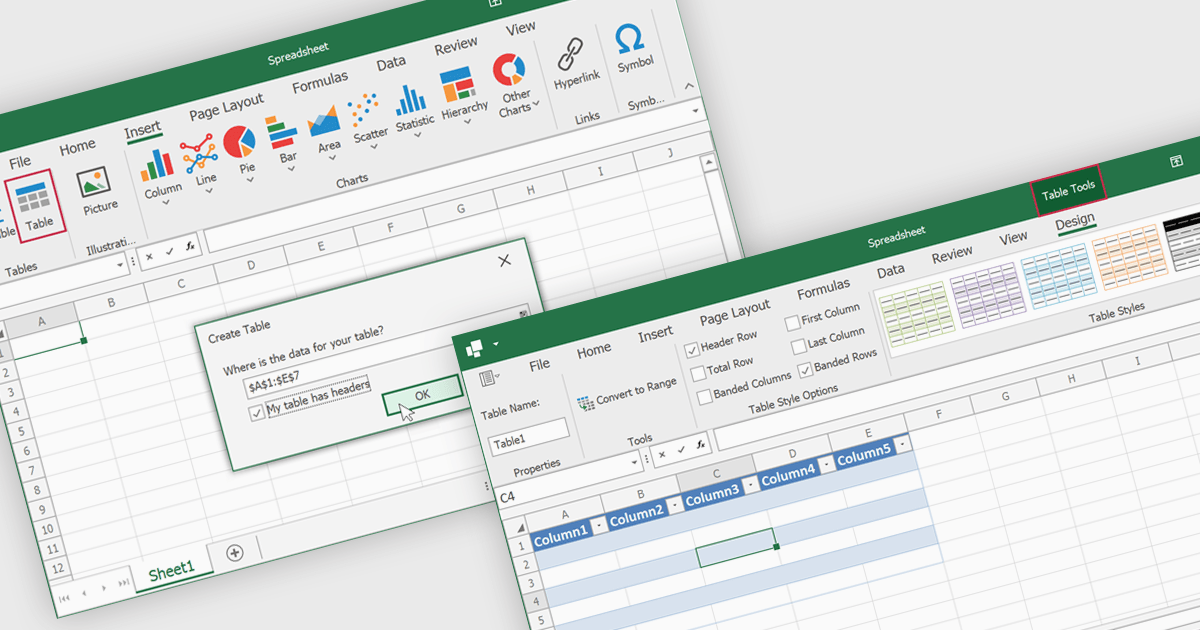
Spreadsheet tables are organized groups of data in a spreadsheet, often with a header row and a range of cells containing related information. They make data management easier by grouping related information, improving how it looks and how easy it is to use. You can use functions and formulas on entire tables to automate calculations and reduce manual work. Tables often let you filter and sort data based on specific criteria, making analysis and reporting easier. Common uses include financial analysis, inventory management, project tracking, and customer databases.
Several WinForms spreadsheet controls offer table support including:
For an in-depth analysis of features and price, visit our WinForms spreadsheet controls comparison.
電話: (888) 850 9911
Fax: +1 770 250 6199


