


公式サプライヤー
公式および認定ディストリビューターとして200社以上の開発元から正規ライセンスを直接ご提供いたします。
当社のすべてのブランドをご覧ください。
The DevExpress Office File API is a powerful .NET library designed to automate work with Microsoft Word documents, Excel spreadsheets, and PDF files without relying on any UI components. It empowers developers to programmatically create, read, edit, export, and print these crucial office files across various platforms, including Windows, Linux, macOS, and even Azure. Its feature set covers a wide range of tasks, from formatting text and inserting images in Word documents to manipulating data and generating charts in Excel workbooks, and even filling interactive forms or extracting text from PDFs. This comprehensive functionality allows developers to integrate seamless document handling directly into their applications, eliminating the need for external software and streamlining workflows.
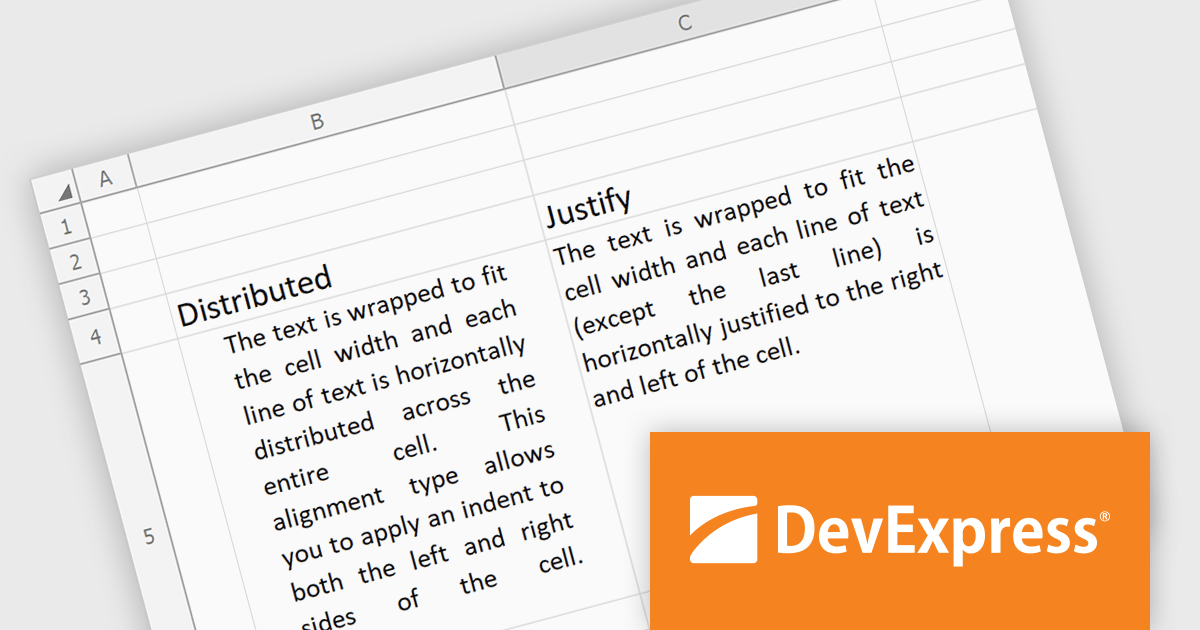
The DevExpress Office File API 24.1 release introduces justified and distributed text alignment to the Spreadsheet Document API. This means that text can now be spread evenly across the entire width of the cell (justified) or with a slight indent on both sides (distributed) - similar to how text appears in word processing software. These formatting options are preserved when exporting the spreadsheet to PDF, allowing users to maintain a consistent presentation across different document formats.
To see a full list of what's new in version 24.1, see our release notes.
DevExpress Office File API is licensed per developer and is available as a Perpetual License with a 12 month support and maintenance subscription. See our DevExpress Office File API licensing page for full details.
DevExpress Office File API is available to buy in the following products:
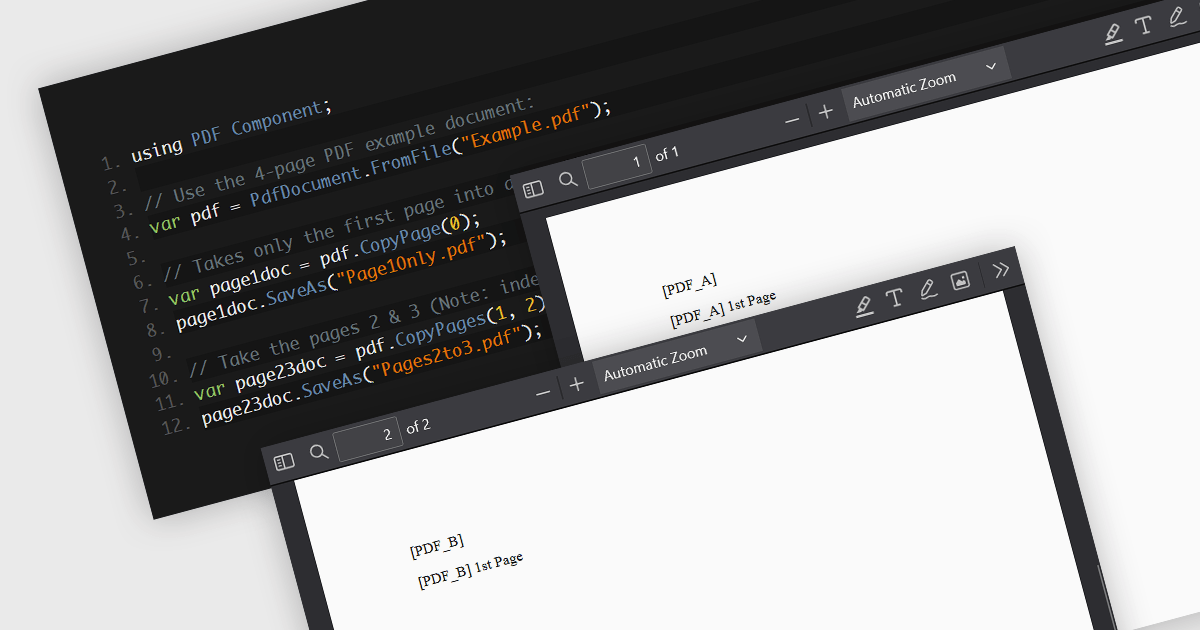
PDF splitting functionality enables users to divide a single PDF document into multiple smaller files, each containing a subset of the original document's pages. This capability is essential for managing large PDFs by breaking them down into more manageable sections, facilitating easier distribution, storage, and retrieval of specific content. The primary benefits of PDF splitting include improved performance due to reduced file size, enhanced organization by isolating relevant information, and increased flexibility in handling and sharing parts of the document without the need to manipulate the entire file. It can also simplify collaboration and review processes, as specific sections can be easily extracted and shared with relevant stakeholders.
Several .NET PDF components allow you to split PDF files, including:
For an in-depth analysis of features and price, visit our comparison of .NET PDF components.
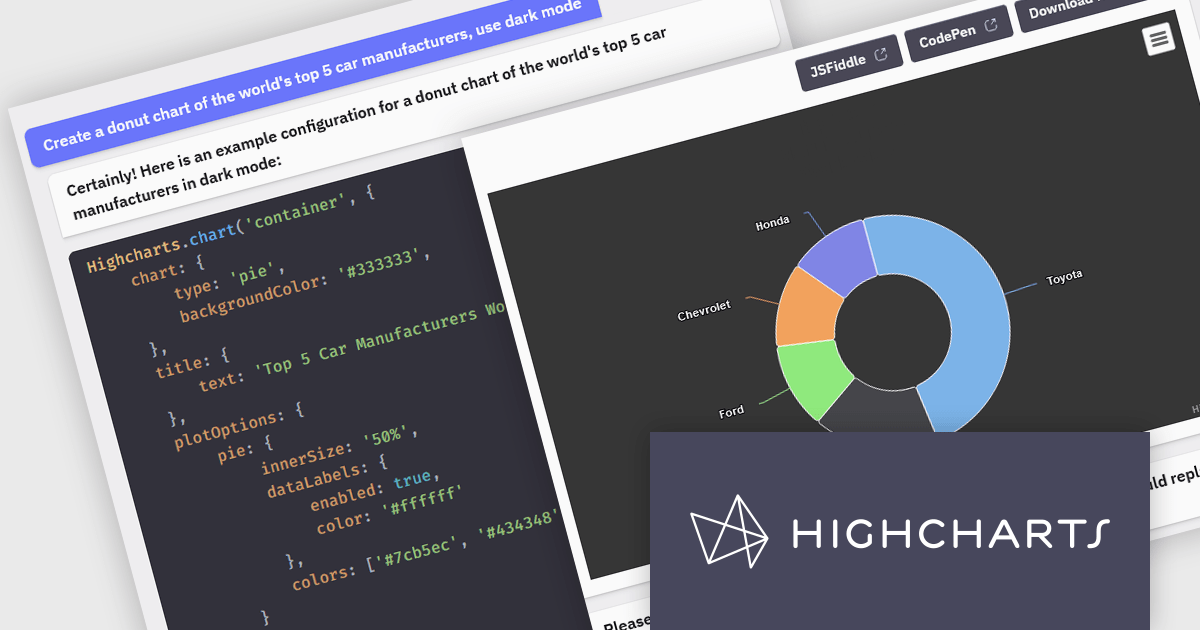
Highcharts is a JavaScript charting framework that allows web developers and data analysts to generate dynamic, visually appealing charts and graphs for websites and web applications. It can display a variety of chart types, including line, spline, area, column, bar, pie, scatter, and many more. Highcharts is well-known for its ease of use, rich documentation, and ability to handle huge datasets efficiently. Features include responsive design, accessibility support, and cross-browser compatibility. Its customization capabilities allow users to create bespoke data visualizations that increase engagement and provide insightful data presentations.
The Highcharts GPT add-on (powered by ChatGPT), and GitHub Copilot support in Highsoft products provide software developers with significant productivity enhancements by integrating AI-driven code assistance directly into their workflow. The Highcharts GPT add-on leverages natural language processing to generate and customize complex chart configurations, reducing the time and effort required for manual coding and enabling developers to focus on higher-level design and functionality. GitHub Copilot integration further streamlines development by offering intelligent code completions and suggestions, facilitating rapid prototyping and error reduction. Together, these Artificial Intelligence tools enhance coding efficiency, improve accuracy, and accelerate the development of sophisticated data visualizations.
For more information see the Highcharts GPT and Highcharts + Github Copilot blog posts.
Highcharts Core is licensed on an annual or perpetual basis, OEM licenses, and Advantage Renewals. It is licensed per Developer and has several license options including Internal, SaaS, SaaS+, and Self Hosted. See our Highcharts Core licensing page for full details.
Learn more on our Highcharts Core product page.
TX Text Control .NET Server for ASP.NET is a server-side component that equips developers with a powerful word processing engine for web applications. It integrates seamlessly with ASP.NET, ASP.NET Core, popular frameworks like Angular and React, and JavaScript, allowing you to build dynamic document editing and generation features directly within your web applications. This empowers you to create documents on the fly using data from various sources, edit existing documents in the browser, and handle functionalities like PDF processing and form filling, all on the server-side.
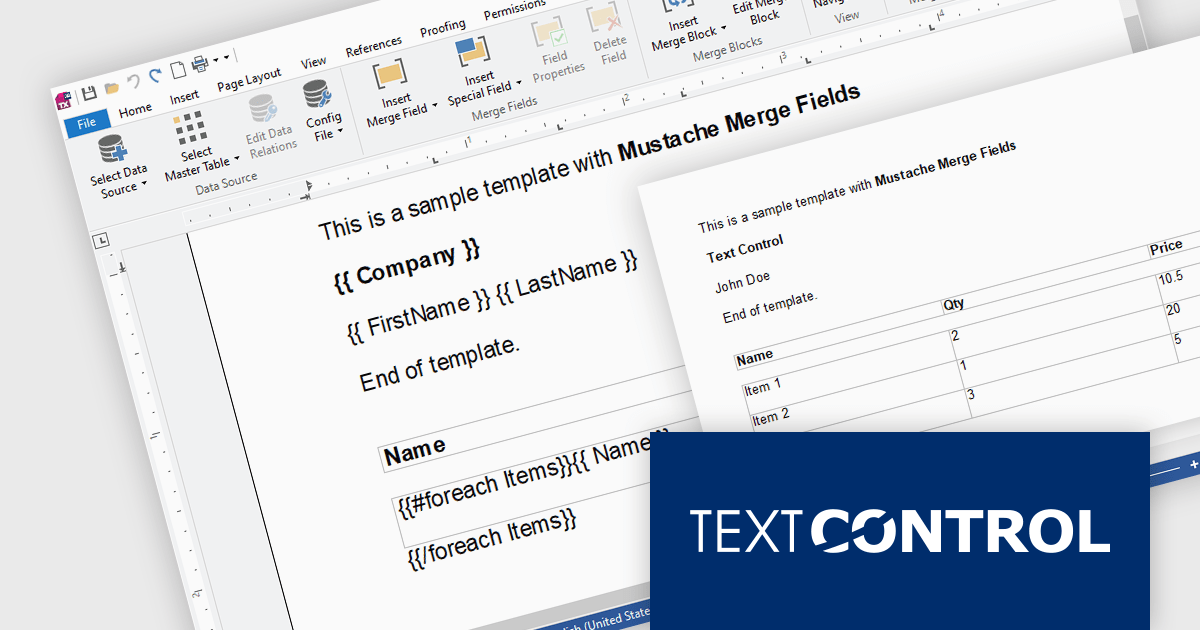
Mail Merge is a fundamental requirement for word processing applications. In this blog post, Text Control's Bjoern Meyer shows you to use Mustache Syntax with your TX Text Control web applications to insert merge fields into templates in formats that do not support MS Word merge fields, such as TXT or HTML. He also demonstrates how to use merge block to repeat content based on a collection of items. Detailed code is included to get you on your way.
Read the full blog and discover the power of using mustache syntax along with TX Text Control's MailMerge engine.
TX Text Control .NET Server for ASP.NET is licensed per Developer and includes Run-time licensing for up to 5 Servers. Licensing is perpetual, and include a 1-year subscription. See our TX Text Control .NET Server for ASP.NET licensing page for more details.
Learn more about TX Text Control .NET Server for ASP.NET.
AdminStudio, by Flexera, empowers IT teams to seamlessly and securely package and deploy applications across various platforms. This comprehensive suite automates key processes, from building new packages to testing compatibility and mitigating risks, ensuring efficient and reliable software distribution within your organization. Whether managing physical or virtual applications, AdminStudio simplifies the entire journey, from initial packaging to endpoint delivery, ultimately driving greater efficiency and minimizing deployment risks.
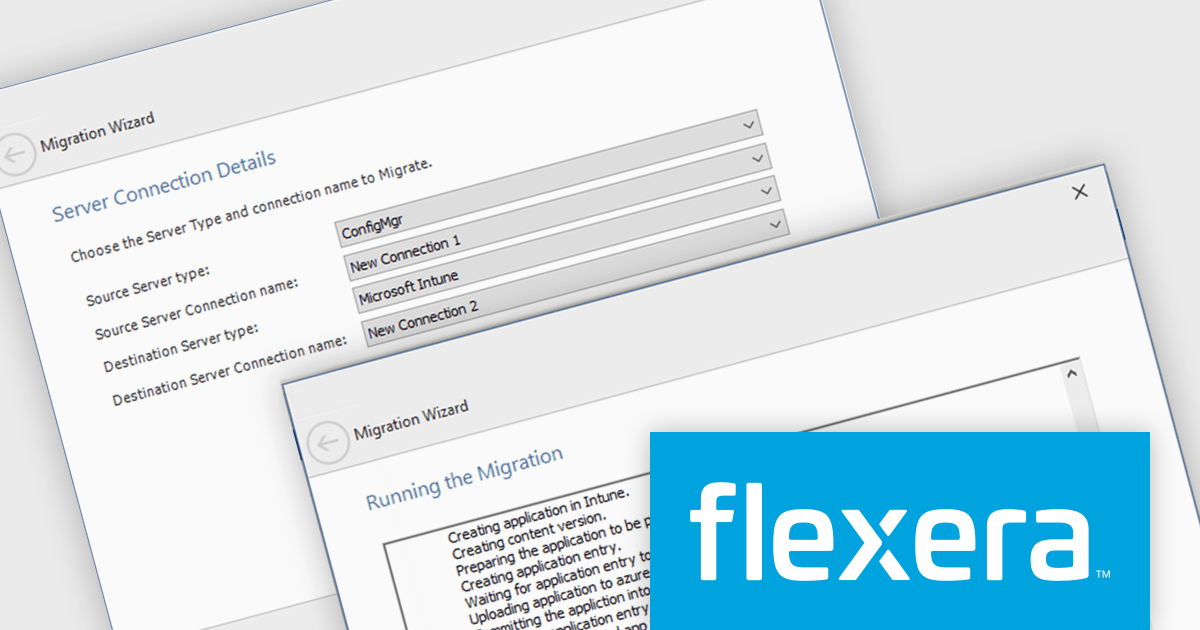
AdminStudio 2024 introduces a game-changing capability for migrating applications from Configuration Manager (ConfigMgr) to Microsoft Intune. The new Bulk Migration Wizard button simplifies this process for organizations looking to move their applications to the cloud. This wizard streamlines the migration of multiple applications at once, converting them from their ConfigMgr format to the compatible intunewin format required by Intune. With a few clicks, you can publish these converted applications directly to Intune, saving you significant time and effort compared to manual migration.
To see a full list of what's new in version 2024, see our release notes.
AdminStudio is licensed per user and is available as a 3 Year Timed Subscription. See our AdminStudio Professional or AdminStudio Enterprise licensing pages for full details.
For more information, visit our product pages:
電話: (888) 850 9911
Fax: +1 770 250 6199


