


公式サプライヤー
公式および認定ディストリビューターとして200社以上の開発元から正規ライセンスを直接ご提供いたします。
当社のすべてのブランドをご覧ください。
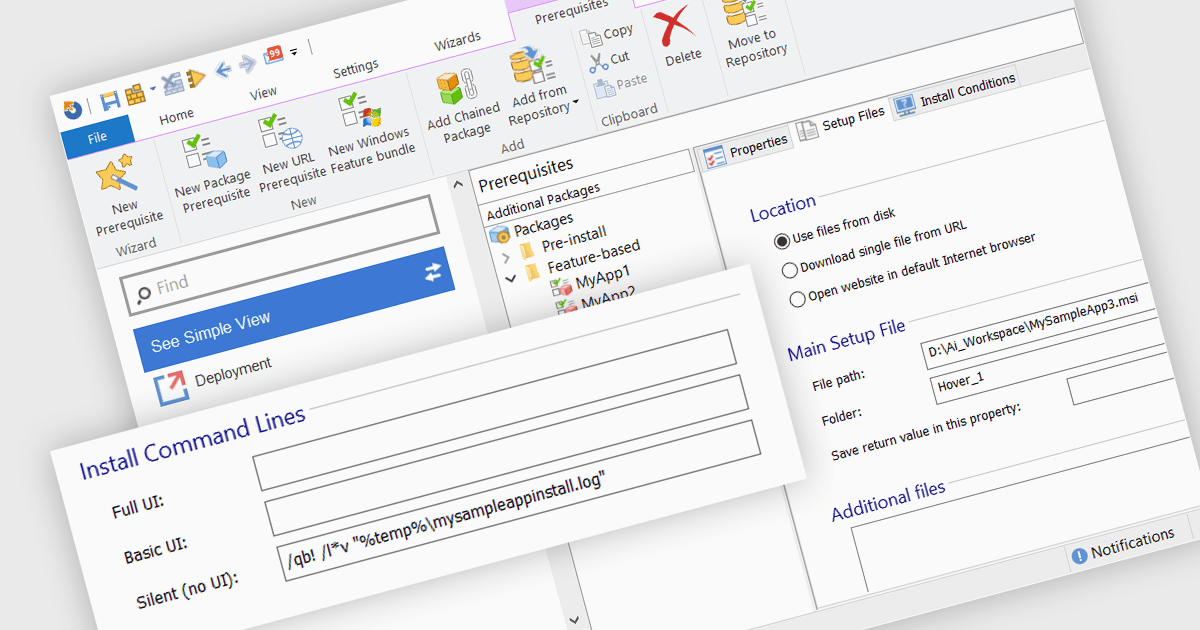
The ability to create silent installations, or unattended installations, refers to the process of deploying software onto a device without user interaction. This is achieved through pre-defined parameters that dictate installation options, configuration settings, and destination directories. This capability is valuable for IT professionals who need to automate software deployments across multiple devices, ensuring consistency and reducing manual intervention, especially in large organizations.
Several installation tools offer the ability to create silent installations including:
For an in-depth analysis of features and price, visit our installation tools comparison.
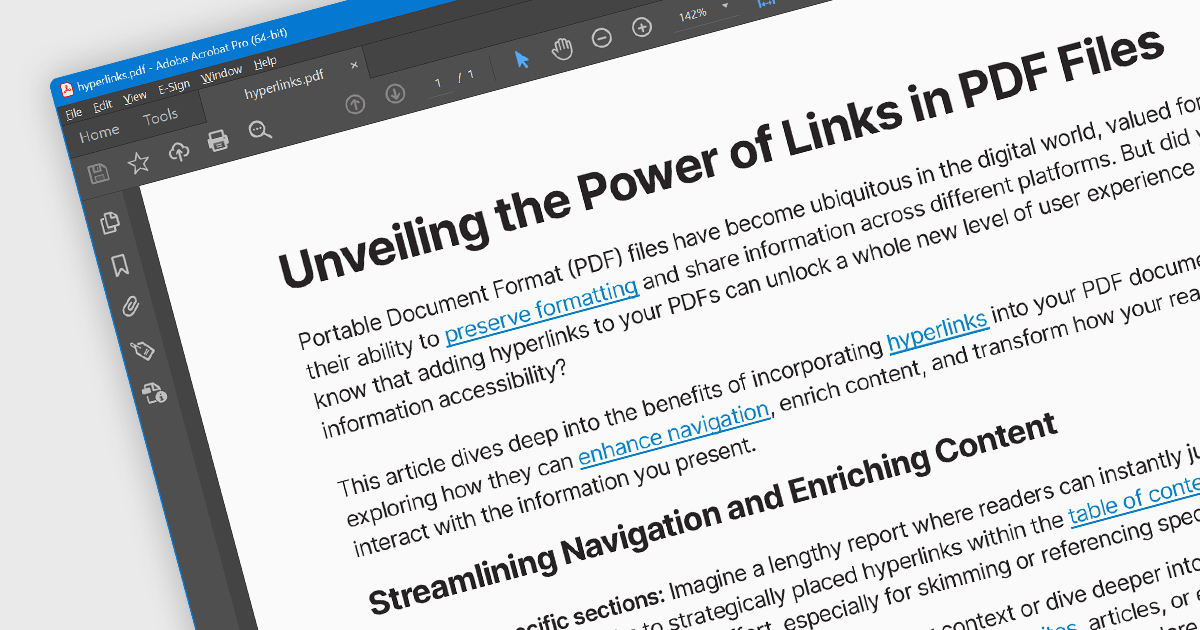
Hyperlink navigation allows users to seamlessly jump to different sections of the document, external websites, or other files by clicking on embedded hyperlinks. These links are typically highlighted or underlined, and clicking them triggers actions based on their type, such as navigating to a specific page within the PDF, opening a web page, or launching an external application. This functionality enhances user experience by enabling easy exploration of related information and resources directly from within the PDF document.
Several WinForms PDF Viewer components offer hyperlink navigation, including:
For an in-depth analysis of features and price, visit our WinForms PDF Viewer components comparison.
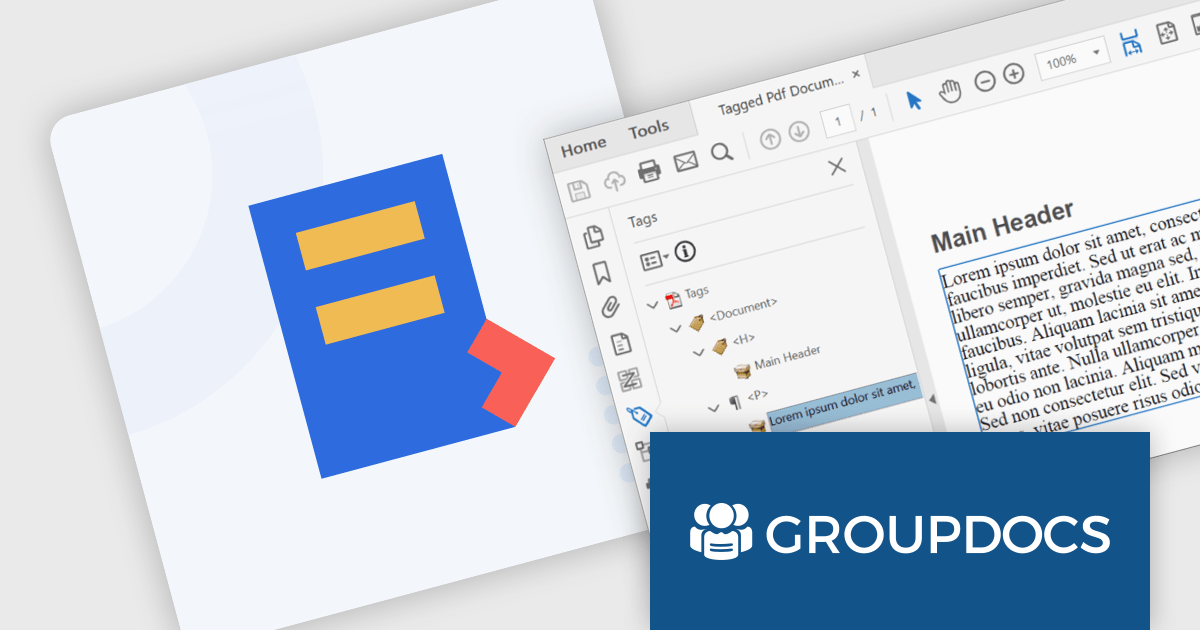
GroupDocs.Conversion for Node.js via Java is a powerful document conversion API designed to seamlessly integrate with your JavaScript applications. It empowers you to effortlessly convert between over 50 document and image formats, including popular Microsoft Office and OpenDocument files, PDFs, and various image types. This Java-based solution eliminates the need for third-party tools, offering a convenient and efficient way to handle document conversions directly within your Node.js projects.
The GroupDocs.Conversion for Node.js via Java V24.2 release adds the ability to convert tagged DOCX files to tagged PDF. This feature ensures the accurate transfer of semantic structure, including headings, paragraphs, tables, and other essential elements, from DOCX to PDF. This empowers users with disabilities to leverage screen readers and other assistive technologies effectively, promotes content clarity and comprehension, and safeguards crucial information during format changes, making your documents accessible.
To see a full list of what's new in V24.2, see our release notes.
GroupDocs.Conversion for Node.js via Java is offered as Developer Small Business, Developer OEM, Site Small Business and Site OEM licenses catering to a range of business needs. Licenses are perpetual, and include 1 year of support and maintenance. Subscription renewals are also available. See our GroupDocs.Conversion for Node.js via Java licensing page for full details.
GroupDocs.Conversion for Node.js via Java is available in the following products:
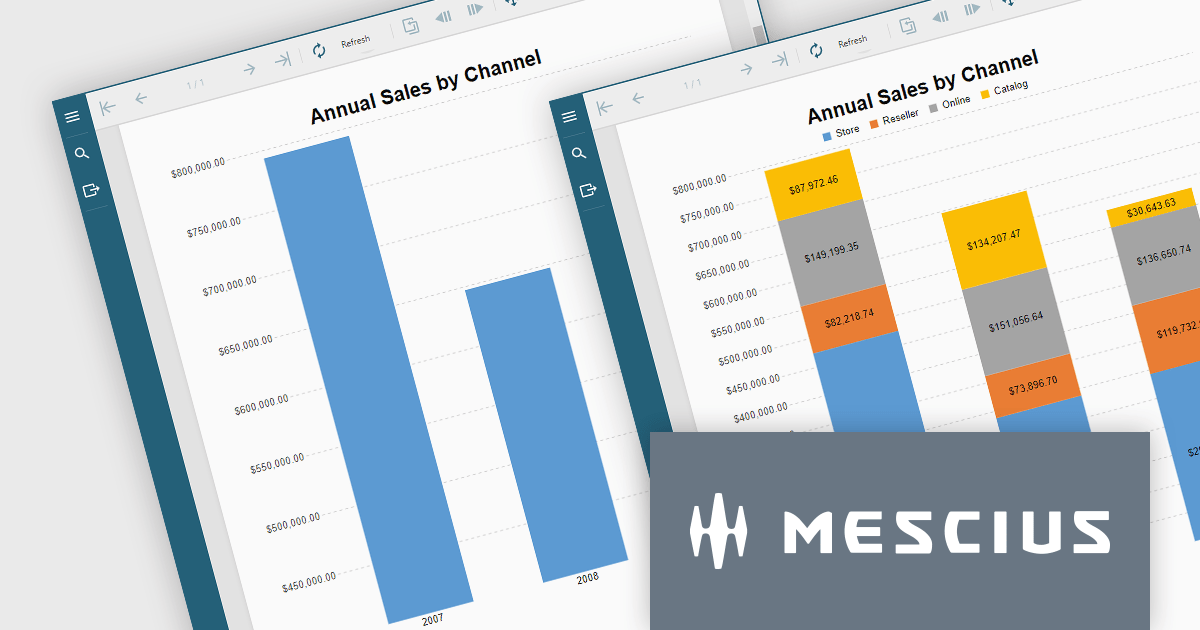
ActiveReportsJS is a reporting tool for web applications that allows developers and report authors to easily design and display reports within their applications. With a wide range of features, such as drill-down, runtime data filtering, and parameter-driven reports, as well as compatibility with popular frameworks, ActiveReportsJS simplifies the process of creating and managing reports.
In this blog post, MESCIUS Technical Engagement Engineer Joel Parks shows you how to utilize ActiveReportsJS to incoporate charts into your JavaScript report, and bind your chart data together through the use of parameterized drill-through navigation, allowing your users to easily traverse between them. Steps include:
Read the complete blog now, and start adding drill-through chart functionality to your JavaScript report using ActiveReportsJS.
ActiveReportsJS is licensed on an annual subscription or perpetual basis and is available as a Single Deployment License for non-commercial use, and as a Single Domain License or Unlimited Domain License for commercial and/or SaaS use. See our ActiveReportsJS licensing page for full details.
For more information, visit our ActiveReportsJS product page.
Aspose.BarCode for Python via .NET empowers your Python applications with robust barcode functionality. This versatile library seamlessly integrates into your development workflow, enabling effortless generation and scanning of diverse barcode symbologies. Enjoy granular control over barcode appearance, customizing colors, size, captions, and more to suit your precise requirements. Efficient multi-threading ensures swift and accurate recognition of single or multiple barcodes within images, optimizing your productivity and data processing efficiency.
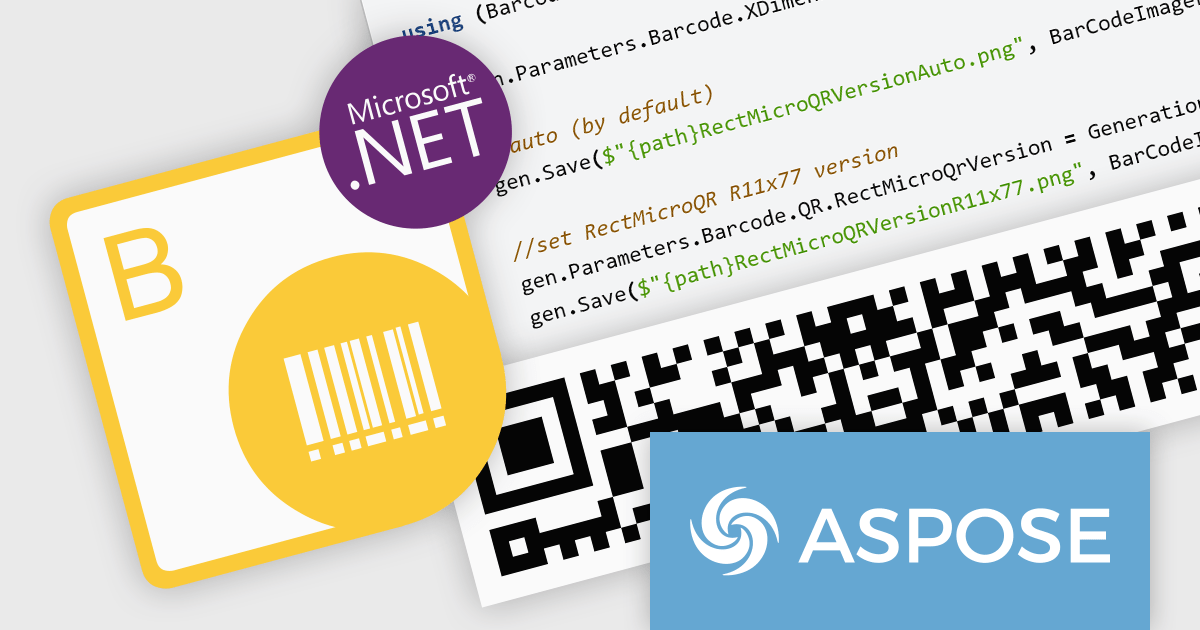
The Aspose.BarCode for Python via .NET V24.1 release adds support for rMQR barcodes. This expands its utility in industries employing high-volume data transmission and real-time tracking. rMQR's high density and error correction capabilities excel in encoding large datasets within compact barcodes, ideal for product authentication, logistics, and supply chain management.
To see a full list of what's new in V24.1, see our release notes.
Aspose.BarCode for Python via .NET is offered as Developer Small Business, Developer OEM, Developer SDK, Site Small Business, Site OEM, and Site SDK licenses catering to a range of business needs. Licenses are perpetual, and include 1 year of support and maintenance. Subscription renewals are also available. See our Aspose.BarCode for Python via .NET licensing page for full details.
Aspose.BarCode for Python via .NET is available in the following products:
電話: (888) 850 9911
Fax: +1 770 250 6199


