


公式サプライヤー
公式および認定ディストリビューターとして200社以上の開発元から正規ライセンスを直接ご提供いたします。
当社のすべてのブランドをご覧ください。
JetBrains Academy is an online educational platform designed to help developers advance their programming skills. It provides a holistic approach to learning in which users study the theory and immediately put it into practice by building working applications. The project-based learning environment is integrated with JetBrains IDEs, and allows developers to learn Java, Python, and other programming languages with ease.
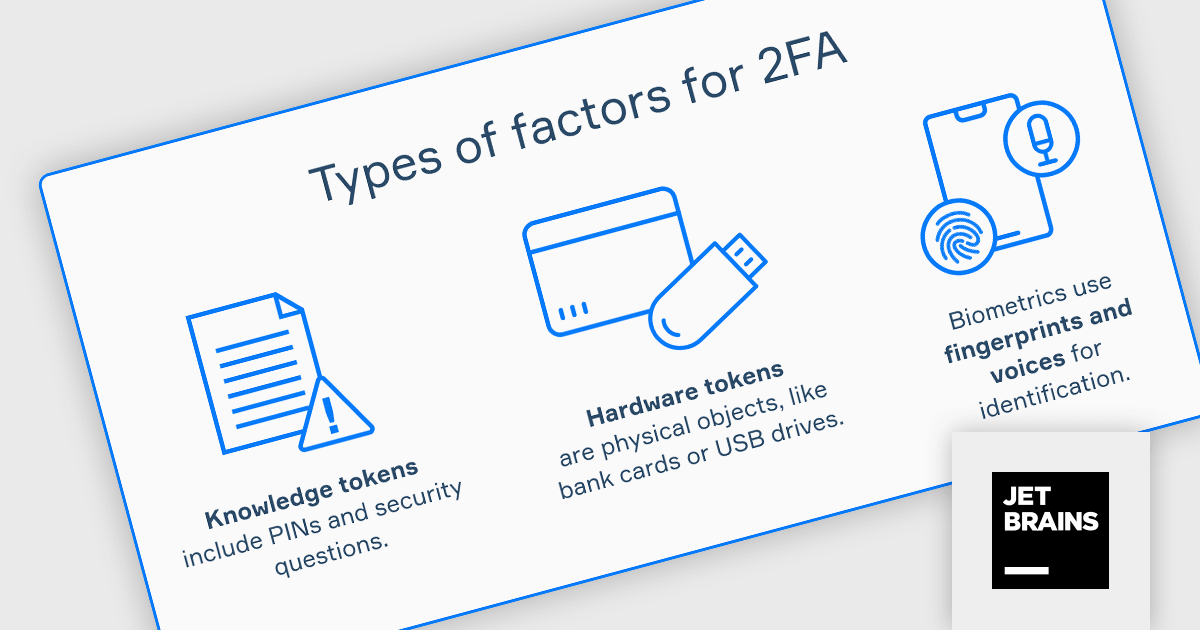
The JetBrains Academy February 2024 update adds a new Two-Factor Authentication (2FA) topic, which examines the multifaceted role of 2FA in bolstering overall account security. The topic covers its impact on user experience and explores the significance of implementing robust backup and recovery options to ensure uninterrupted access and safeguard valuable data. Users will learn about 2FA methods and how they can be implemented within their applications.
To see a full list of what's new, see our release notes.
JetBrains Academy is licensed per user as a commercial annual subscription. See our JetBrains Academy for Organizations licensing page for full details.
For more information, visit our JetBrains Academy for Organizations product page.
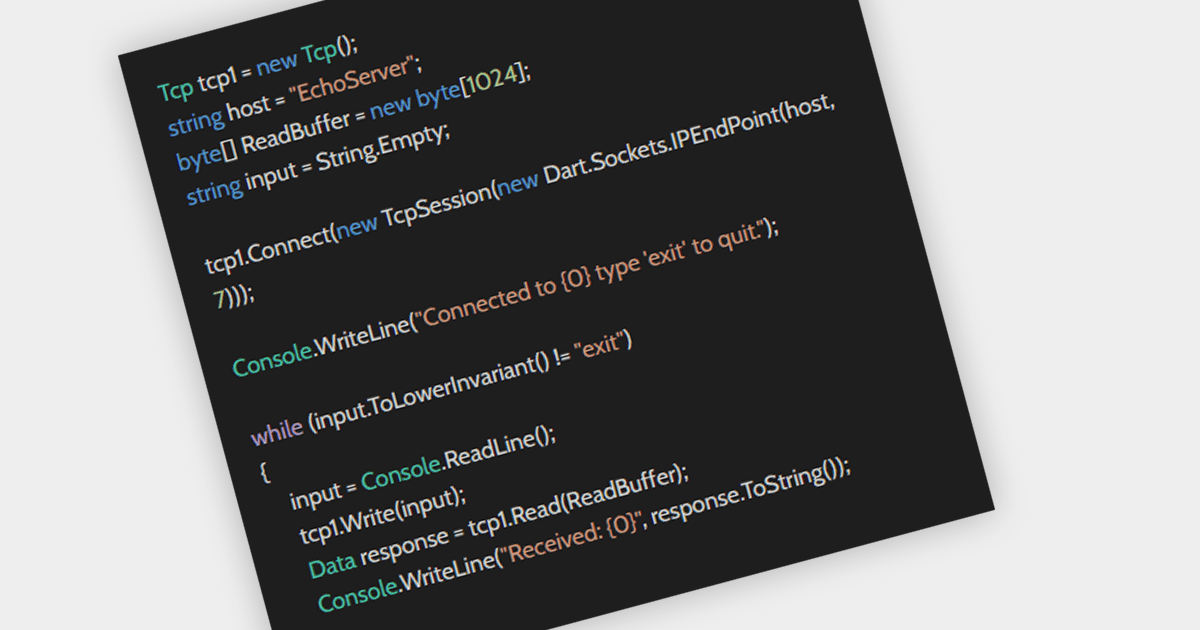
Network tracing offers in-depth visibility into data flow by capturing and analyzing specific packets traversing designated network segments. It provides granular insights for software developers including pinpointing network-related issues, optimizing performance, and gaining a deeper understanding of the user experience. Additionally, network security analysis utilizes tracing to monitor traffic for suspicious activity or unauthorized access by tracking data flows and identifying potential vulnerabilities. This comprehensive approach empowers developers and security professionals to effectively manage and secure their networks.
Several .NET Comms & Messaging components offer tracing functionality including:
For an in-depth analysis of features and price, visit our .NET Comms & Messaging components comparison.

Telerik UI for WPF is an extensive UI library specifically designed for building modern and feature-rich business applications using the Windows Presentation Foundation (WPF) framework. It offers many customizable controls, ranging from data-driven grids and charts to specialized navigation and input components. The suite emphasizes performance and user experience, providing data virtualization for handling large datasets efficiently and ensuring visually appealing interactions.
The Telerik UI for WPF 2024 Q1 update streamlines date selection in your WPF applications with a new DateRangePicker control. This intuitive scheduling component empowers users to effortlessly choose date intervals through interactive calendar popups. It supports pre-defined ranges like "Last Week" or "This Month", as well as custom selections. Developers gain further control with unselectable "blackout date" functionality and extensive customization options, simplifying user interaction and data filtering within their WPF applications.
To see a full list of what's new in 2024 Q1, see our release notes.
Telerik UI for WPF is licensed per developer and is available as a perpetual license with a one year support subscription, which is available in three tiers: Lite, Priority or Ultimate. See our Telerik UI for WPF licensing page for full details.
Telerik UI for WPF is available to buy in the following products:
GroupDocs.Conversion for .NET is a powerful and versatile library designed to facilitate seamless document conversion within any .NET application. It empowers developers to effortlessly transform documents between various formats, including PDF, Microsoft Office documents (DOC, DOCX, XLS, XLSX, PPTX), HTML, eBook formats, and image types.
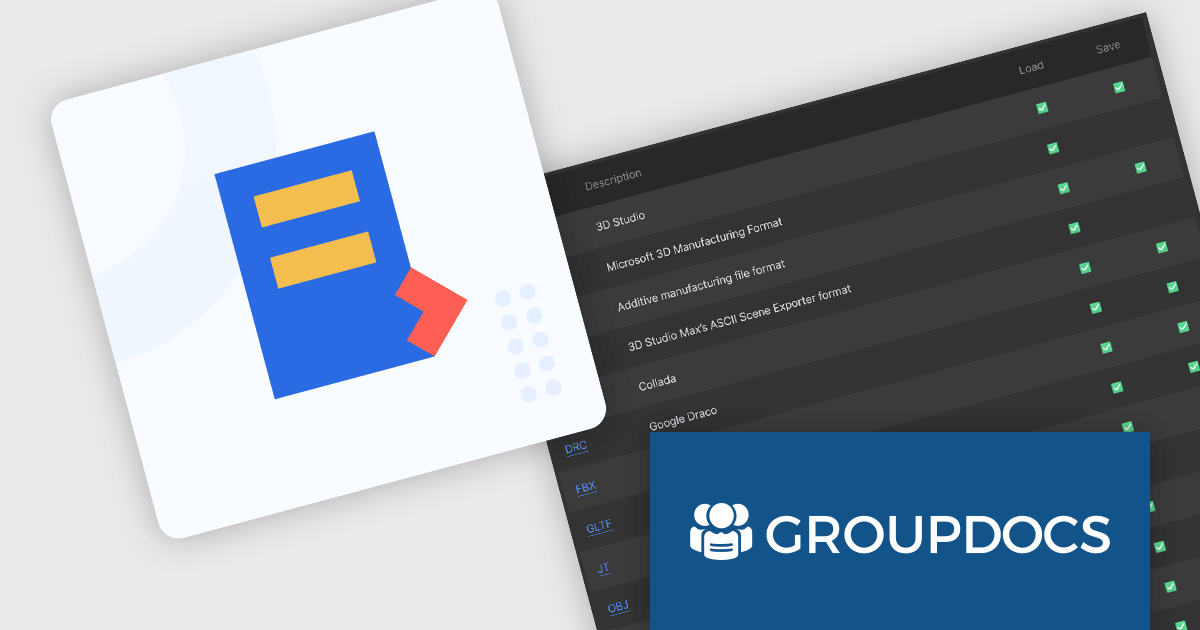
The GroupDocs.Conversion for .NET V24.1 release adds the ability to convert from CAD formats to IFC, GLB, OBJ, 3DS and U3D. Converting to lightweight formats like GLB and OBJ facilitates easy 3D model viewing on web platforms and mobile devices, increasing project transparency, and making it easier to collaborate across a diverse range of software.
To see a full list of what's new in V24.1, see our release notes.
GroupDocs.Conversion for .NET is offered as Developer Small Business, Developer OEM, Site Small Business, and Site OEM licenses catering to a range of business needs. Licenses are perpetual, and include 1 year of support and maintenance. Subscription renewals are also available. See our GroupDocs.Conversion for .NET licensing page for full details.
GroupDocs.Conversion for .NET is available in the following products:

Smart HTML Elements is an enterprise-grade UI library offering pre-built web components for developers in Angular, React, Vue, Blazor, and JavaScript. It boasts over 60 ready-to-use components like grids, charts, schedulers, and editors, all featuring two-way data binding, responsiveness, accessibility, and theming capabilities. This library helps developers rapidly build dynamic and modern web applications with consistent look-and-feel and rich functionalities, accelerating development time and ensuring professional quality.
The Smart HTML Elements v18.0.0 release adds a new grid card view layout that leverages CSS grid to offer an adaptive container for presenting information in a visually appealing card format. Cards can be dynamically populated with text, images, and other multimedia elements, allowing for customization and adaptation to diverse content types. The responsive layout automatically adjusts to various screen sizes and device orientations, ensuring optimal card arrangement and user experience across platforms.
To see a full list of what's new in v18.0.0, see our release notes.
Smart HTML Elements is licensed per developer and is available as a Perpetual license with 1 year support and maintenance. It includes distribution to Unlimited Web applications, SaaS projects, Intranets and Websites. See our Smart HTML Elements licensing page for full details.
Learn more on our Smart HTML Elements product page.
電話: (888) 850 9911
Fax: +1 770 250 6199


