


公式サプライヤー
公式および認定ディストリビューターとして200社以上の開発元から正規ライセンスを直接ご提供いたします。
当社のすべてのブランドをご覧ください。
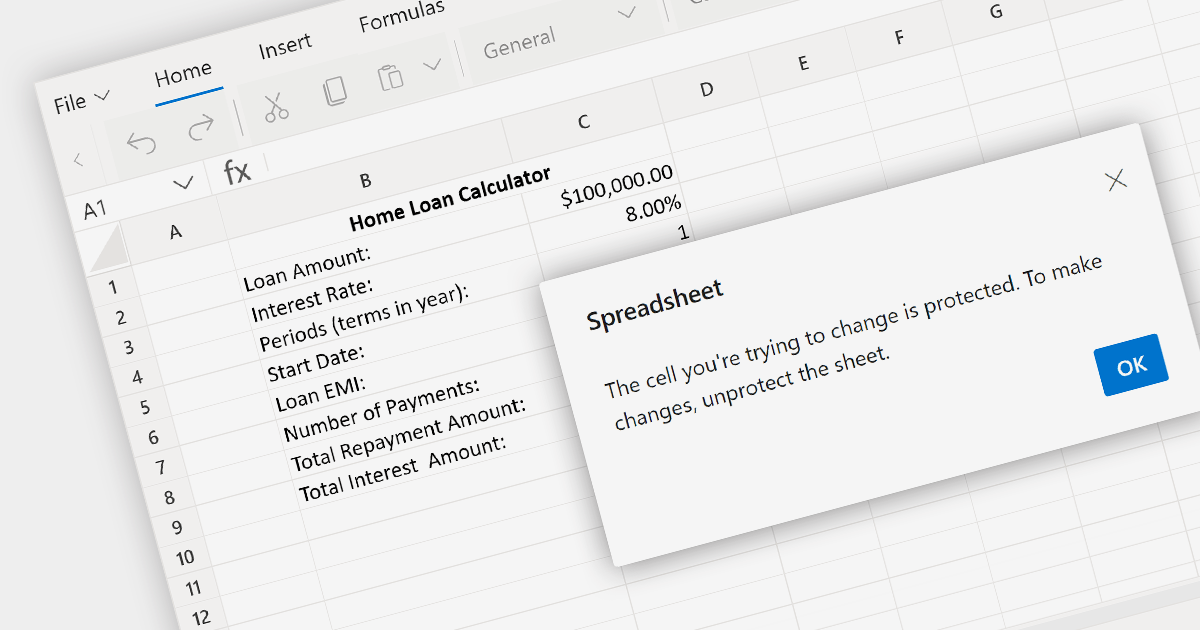
Spreadsheet security features safeguard sensitive data within a spreadsheet. This can include password protection for opening the spreadsheet, encrypting the data, and setting permissions that control who can view or edit specific cells, ranges, or sheets. In an environment where spreadsheets contain confidential or proprietary information, such security features are crucial for preventing unauthorized access and ensuring that data manipulation is restricted to authorized users.
Several ASP.NET Core spreadsheet components provide spreadsheet security including:
For an in-depth analysis of features and price, visit our comparison of ASP.NET Core Spreadsheet components.
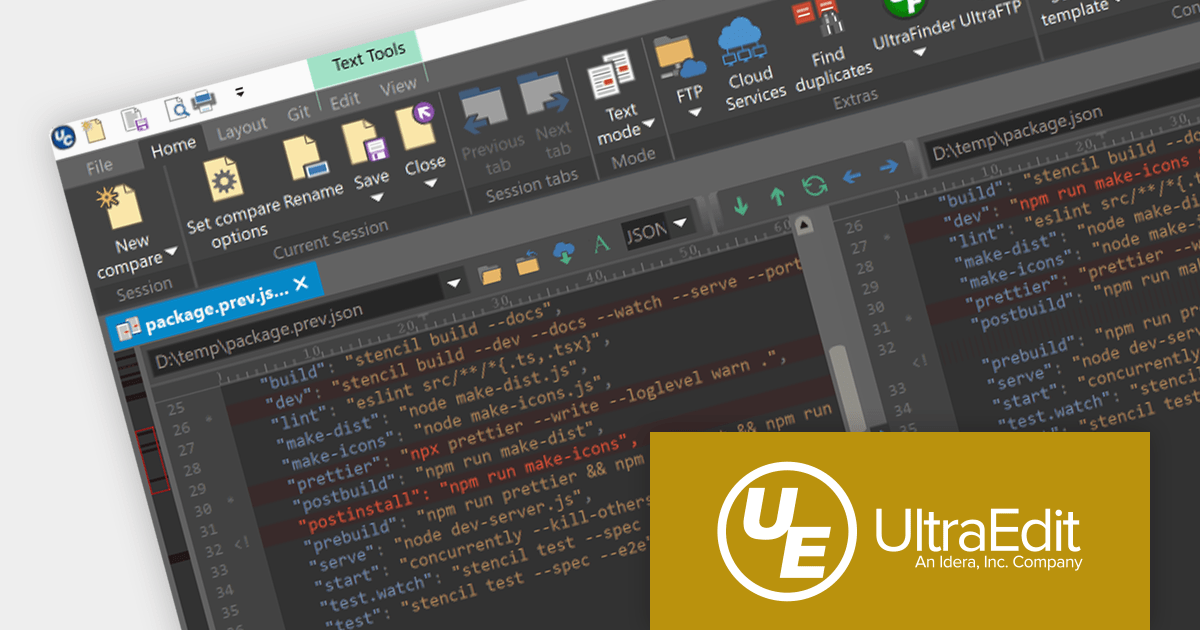
UltraCompare is a versatile file and folder comparison tool that enables users to quickly identify and merge differences between two or more files or folders. It offers a wide range of features for comparing a variety of file types, including text, binary, images, and Microsoft Office documents. Additionally, UltraCompare can compare files stored on local drives, FTP servers, and network shares, making it a valuable tool for software developers, IT professionals, and anyone who needs to compare and synchronize files.
UltraCompare 2023.1 adds a new 'Merge into New File' feature that allows you to compare the differences between two or three files and then safely merge them into a new file. This is ideal for situations where you need to merge selective differences whilst keeping the compared files in their original state. This new functionality is easily accessed from the Folder Compare context menu.
To see a full list of what's new in version 2023.1, see our release notes.
For more information, visit our UltraCompare product page.
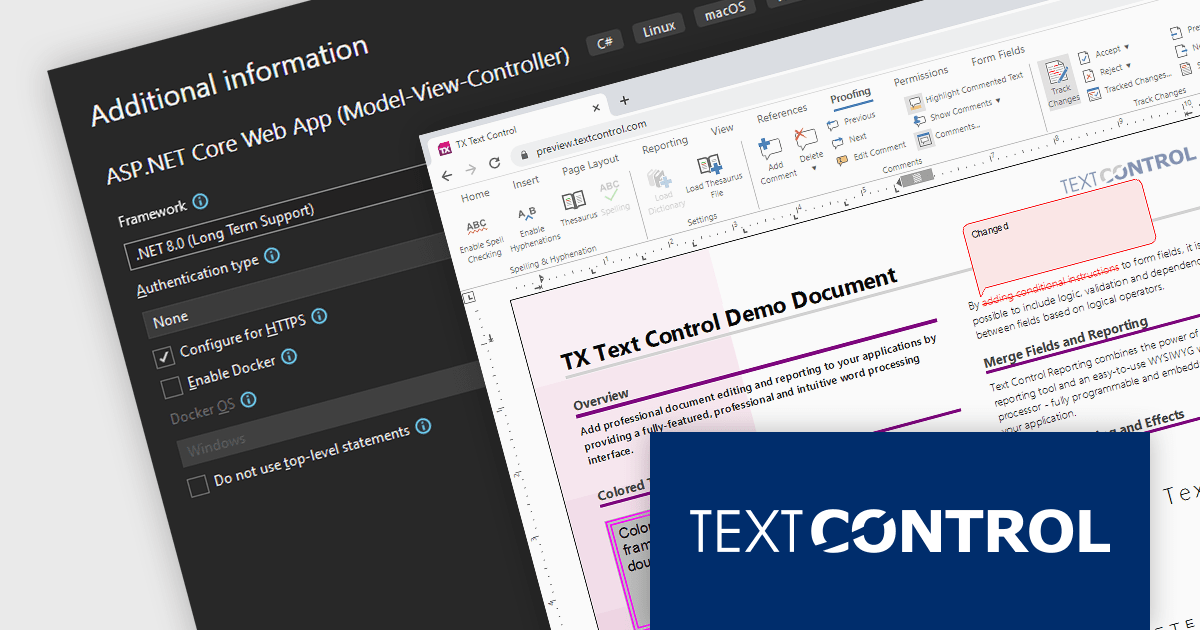
TX Text Control .NET Server for ASP.NET is a comprehensive server-side document processing library for ASP.NET and ASP.NET Core. Features include PDF processing, electronic signatures, file conversion, and reporting / mail merge. It supports client-side frameworks such as JavaScript, Angular, ASP.NET Core, ASP.NET MVC, and ASP.NET WebForms.
The latest release of TX Text Control .NET Server for ASP.NET supports .NET 8, allowing developers to build word processing applications with the new version of Microsoft's popular framework. In testing performed by Text Control, .NET 8 significantly outperformed .NET 6 in both memory usage and document generation performance.
For more information, visit our TX Text Control .NET Server for ASP.NET product page.
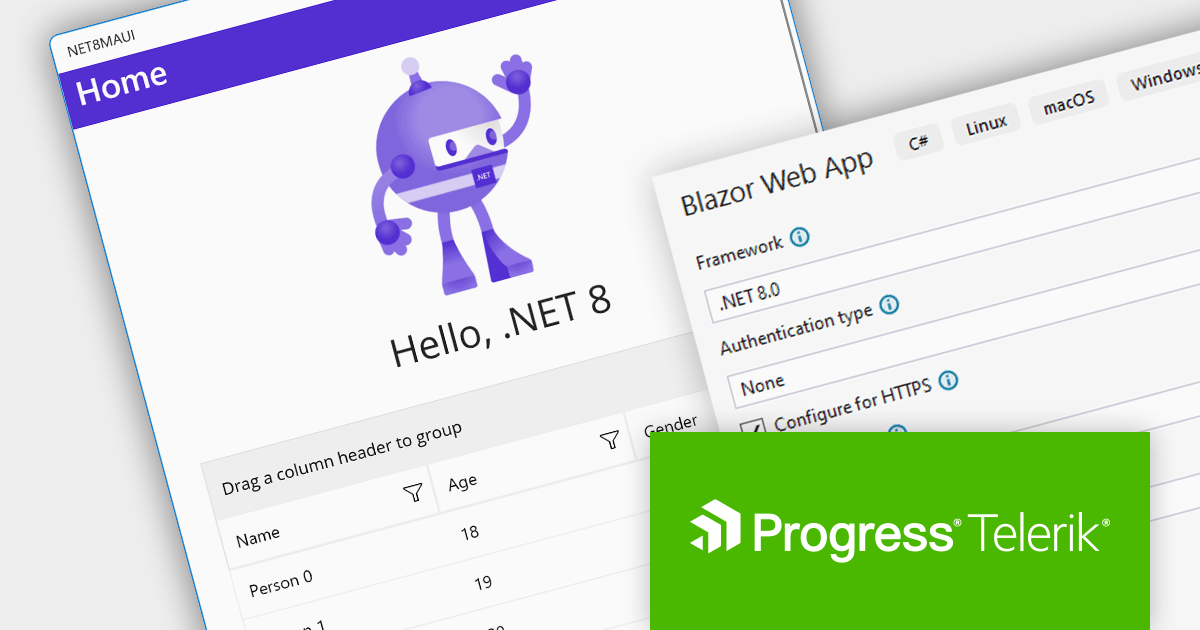
Progress Telerik is a leading software publisher that provides a range of tools and solutions to help developers build and deploy modern applications. Its product range include UI libraries, reporting tools and testing frameworks. Telerik products are used by millions of developers around the world to build a wide variety of applications.
The following Telerik products have been updated with support for .NET 8, allowing developers to build web, desktop, mobile and reporting apps in the latest version of Microsoft's popular framework:
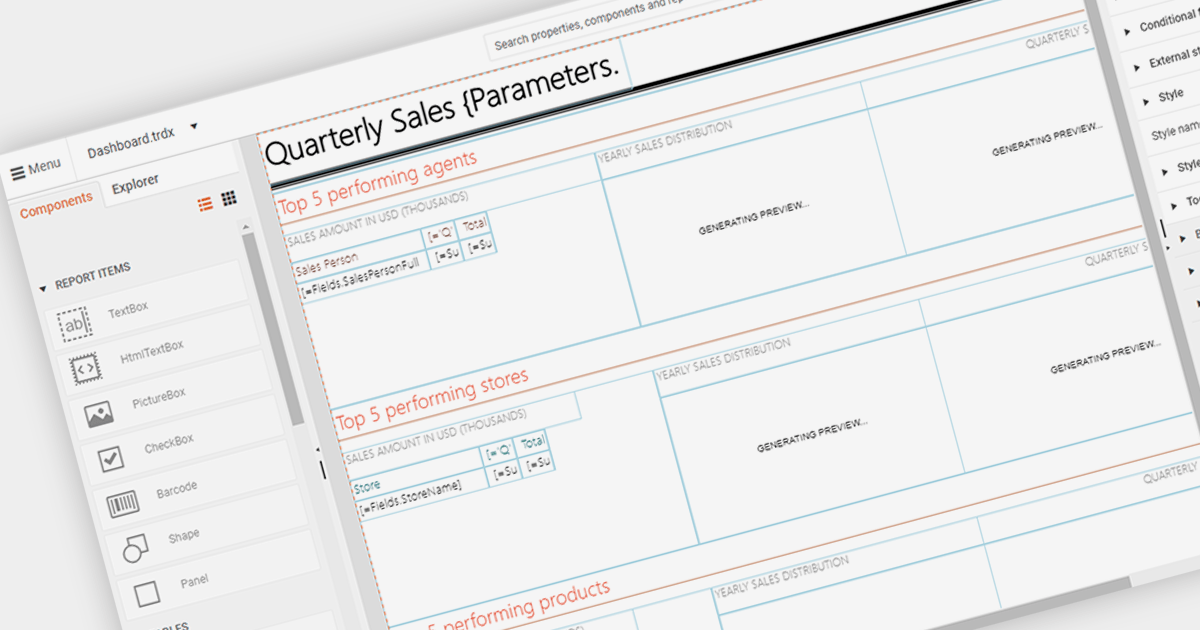
An end user report designer allows non-technical users to create and modify reports directly within an application. This tool often provides a drag-and-drop interface, enabling users to design custom report layouts, define data sources, and set up data bindings without needing to write code. It empowers users to generate personalized reports based on their specific needs and preferences, enhancing the flexibility and usability of the reporting software.
Several Blazor reporting components provide an end user report designer including:
For an in-depth analysis of features and price, visit our comparison of Blazor Reporting components.
電話: (888) 850 9911
Fax: +1 770 250 6199


