


公式サプライヤー
公式および認定ディストリビューターとして200社以上の開発元から正規ライセンスを直接ご提供いたします。
当社のすべてのブランドをご覧ください。
Data filtering and grouping in reporting enables developers to create reports that organize and display data based on user defined criteria, making complex datasets more accessible and actionable. Filtering allows users to focus on the most relevant records, while grouping structures data into meaningful categories that reveal trends, patterns, and relationships. Together, these capabilities improve report clarity, reduce the time required to analyze information, support more informed decision making, and provide a more flexible and efficient reporting experience for both technical and business users.
Several JavaScript reporting controls offer data filtering and grouping including:
For an in-depth analysis of features and price, visit our comparison of JavaScript Reporting Controls.

For the past three years, ComponentSource and Jspreadsheet have worked together to provide developers with powerful spreadsheet and data management solutions for modern web applications. Jspreadsheet offers Excel like functionality for JavaScript, React, Angular, and Vue applications, helping teams create interactive data grids, forms, dashboards, and business applications that can handle large volumes of data with exceptional performance.
A key product in this collaboration is Jspreadsheet Pro, the brand’s flagship spreadsheet component. Featuring more than 400 built in formulas, advanced data handling capabilities, and extensive customization options, it enables developers to deliver familiar spreadsheet experiences directly within their web applications while maintaining full control over data integration and persistence.
This partnership helps ComponentSource differentiate its product offering by providing customers with a market leading spreadsheet solution that complements its extensive portfolio of developer tools. Through ComponentSource’s global sales, licensing, and support services, developers worldwide can easily discover, evaluate, purchase, and deploy Jspreadsheet Pro within their projects.
Learn more about Jspreadsheet.

Converting PDFs to SVG in PDF Viewers enables content to be rendered as scalable vector graphics, keeping text, diagrams, and illustrations sharp at any zoom level. This improves viewing quality, responsiveness, and browser performance while ensuring documents remain crisp across all devices and high resolution displays. Common use cases include web based PDF viewers, technical documentation, engineering drawings, and applications that support annotations and interactive document experiences.
Several .NET PDF Viewer components allow you to convert PDFs to SVG's, including:
For an in-depth analysis of features and price, visit our comparison of .NET PDF Viewer components.
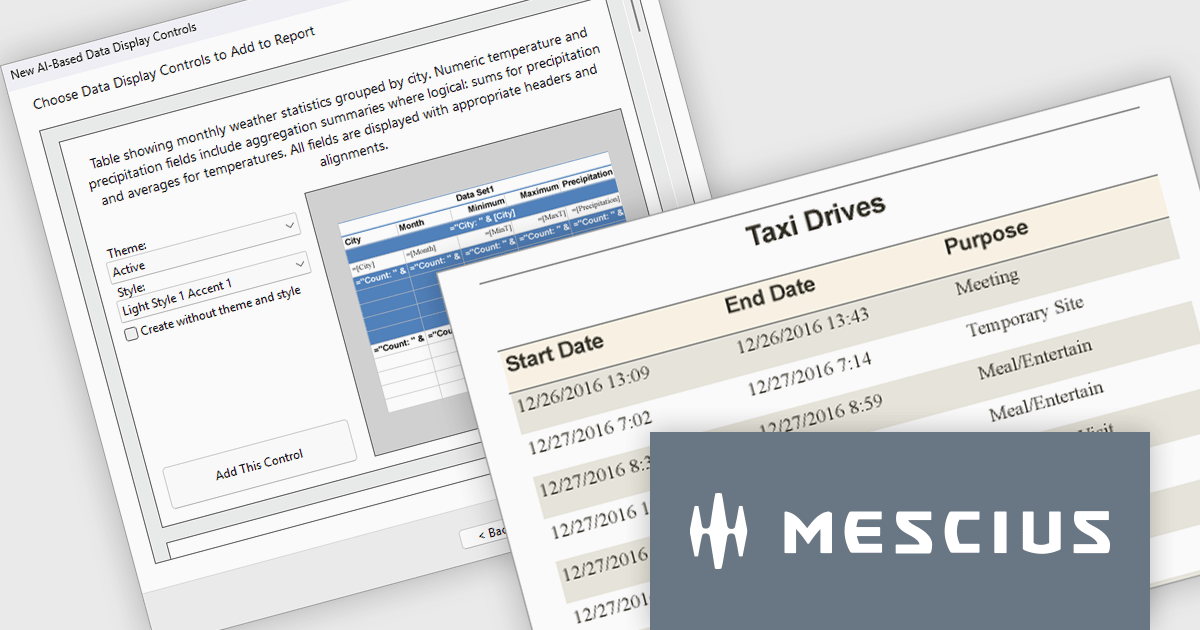
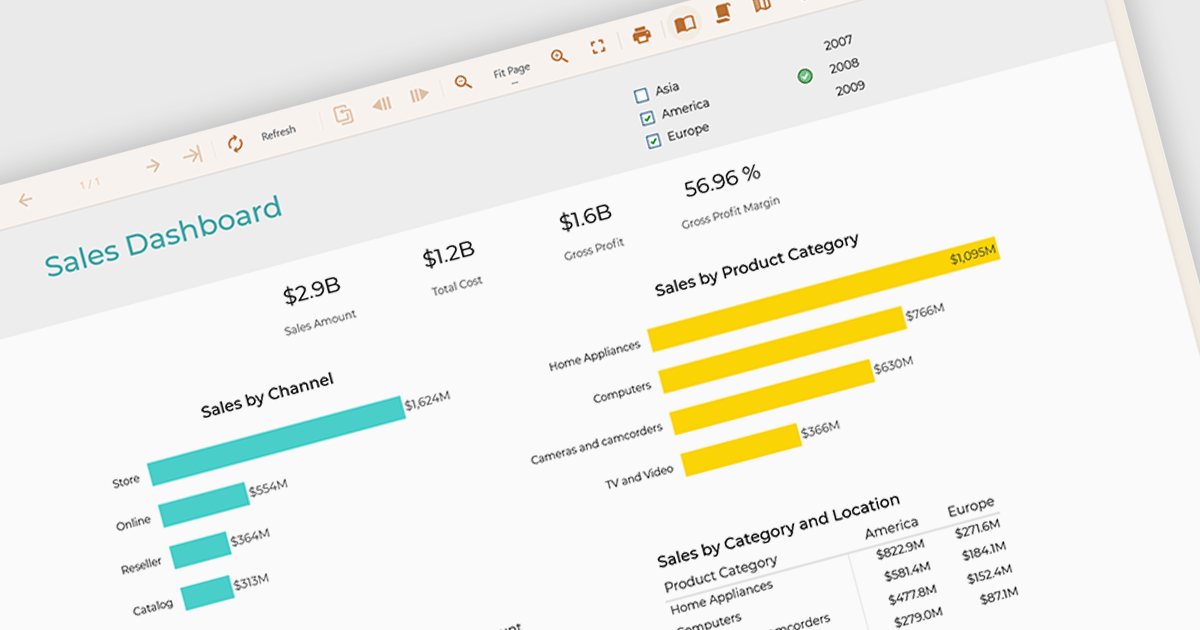
ActiveReports.NET by MESCIUS is a reporting solution for the Microsoft .NET platform that enables developers to create and deliver data-driven reports in web, desktop, and cloud applications. It supports multiple report types, including section, page, and RDL (Report Definition Language) reports, and provides visual designers, a robust rendering engine, and export options such as PDF and Excel. Designed to integrate with modern .NET and ASP.NET Core applications, it helps teams build interactive, enterprise-grade reporting features into their software.
The ActiveReports.NET v20.1 update includes AI Driven Smart Data Regions, enabling developers to generate cleaner and more consistent report layouts automatically. By applying standardized date formatting, removing duplicate columns, and using structured grouped table layouts with appropriate headers, footers, and page breaks, it reduces the need for manual report refinement while improving readability and navigation. This enhancement helps development teams deliver professional quality reports more efficiently and ensures more consistent results from AI generated report designs.
To see a full list of what's new in v20.1, see our release notes.
ActiveReports.NET is licensed per developer. Dependent on geographic location it is available as either an Annual (Timed) Subscription License or as a Perpetual Developer License which comes with 1 year of software updates and support. Each developer requires a license to design, develop, or maintain applications. The Annual Subscription License must be renewed each year to continue to work with the software. Published applications are royalty free and do not expire. Optional pipeline licenses available for CI/CD build servers. See our ActiveReports.NET licensing page for full details.
Learn more on our ActiveReports.NET product page.
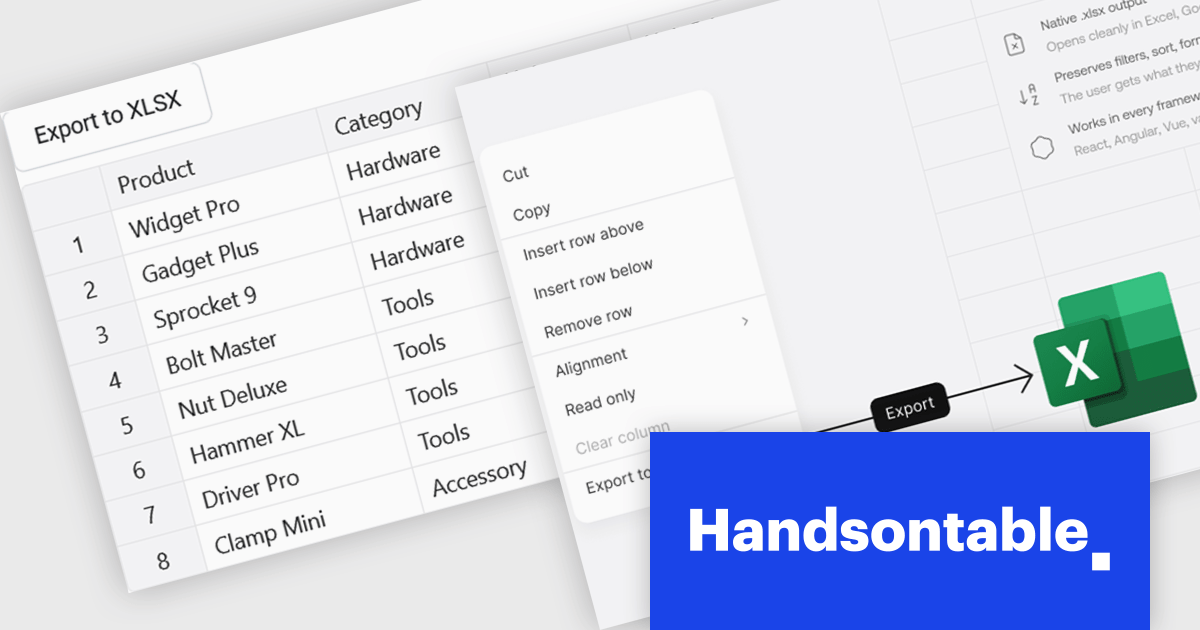
Handsontable is a JavaScript library designed to help developers build interactive data grids into their web applications. Offering a familiar spreadsheet-like interface, it allows users to edit, sort, and filter data with ease. Highly customizable and compatible with popular frameworks like React and Angular, Handsontable empowers developers to build robust data manipulation features into their web applications.
The Handsontable 17.1.0 update includes native export to Excel support, allowing users to save rendered grid data directly to XLSX format. The export reflects the current view of the table, including column order, visible columns, applied filters, sort order, frozen rows and columns, and merged cells. Cell types such as numbers, dates and checkboxes are mapped to their Excel equivalents where possible, helping exported files open cleanly in Microsoft Excel, Google Sheets and Apple Numbers without additional formatting or data preparation. This makes it easier to share and analyze data while maintaining the structure and context users see within the grid.
To see a full list of what's new in version 17.1.0, see our release notes.
Handsontable is licensed per developer and is available as an Annual or Perpetual license with 1 year support and maintenance. See our Handsontable licensing page for full details.
For more information, visit our Handsontable product page.
電話: (888) 850 9911
Fax: +1 770 250 6199


