


公式サプライヤー
公式および認定ディストリビューターとして200社以上の開発元から正規ライセンスを直接ご提供いたします。
当社のすべてのブランドをご覧ください。
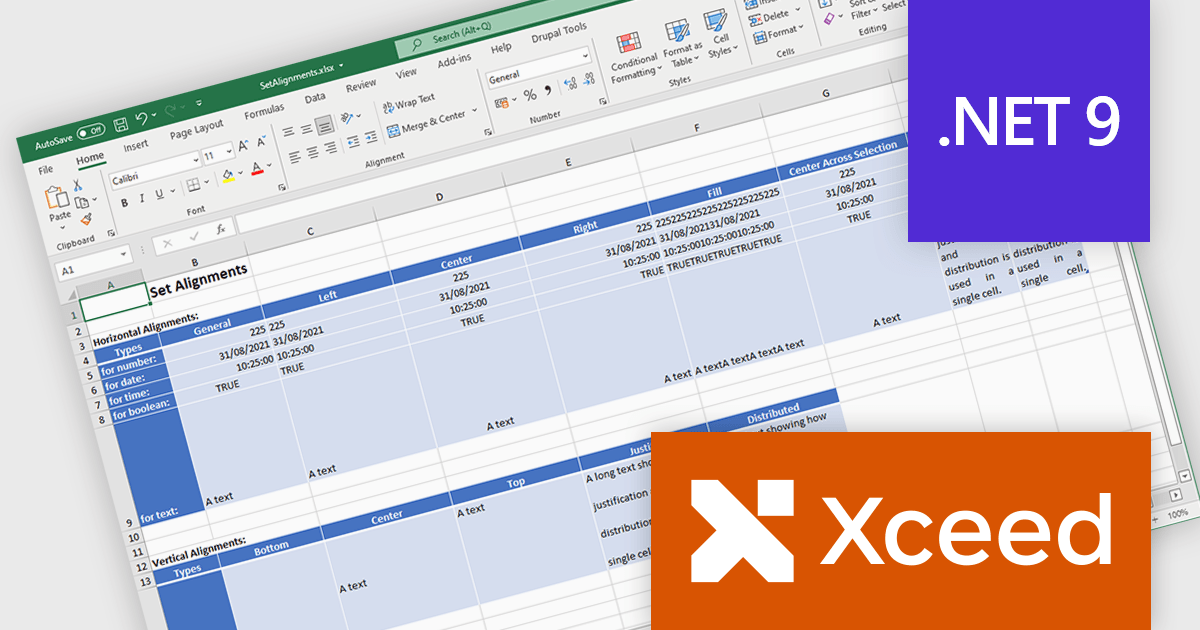
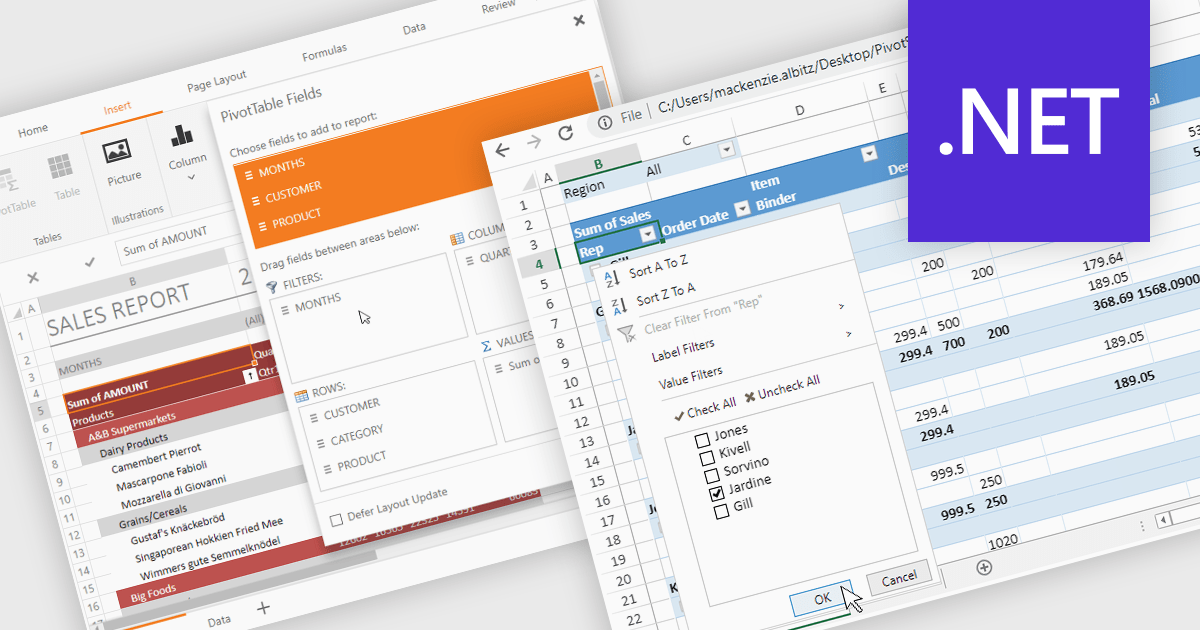
Xceed Workbooks for .NET is a software component designed for .NET developers that enables the creation and manipulation of Microsoft Excel .xlsx files directly within their applications, without requiring Microsoft Excel or Office to be installed; it provides an API that allows for programmatic control over spreadsheet content, formatting, and structure, facilitating tasks such as report generation, data analysis, and document automation.
The Xceed Workbooks for .NET 2.0 release adds support for .NET 9. This primarily ensures compatibility with the latest .NET ecosystem, allowing developers to leverage new features, performance improvements, and security enhancements within their applications. This compatibility future-proofs projects, minimizes integration issues, and maintains alignment with the evolving .NET platform, enabling developers to build more efficient and maintainable software using Xceed Workbooks.
To see a full list of what's new in version 2.0, see our release notes.
Xceed Workbooks for .NET is licensed per developer and is available as a perpetual license with 1 year of updates and support. See our Xceed Workbooks for .NET licensing page for full details.
Xceed Workbooks for .NET is available individually or as part of Xceed Ultimate Suite.
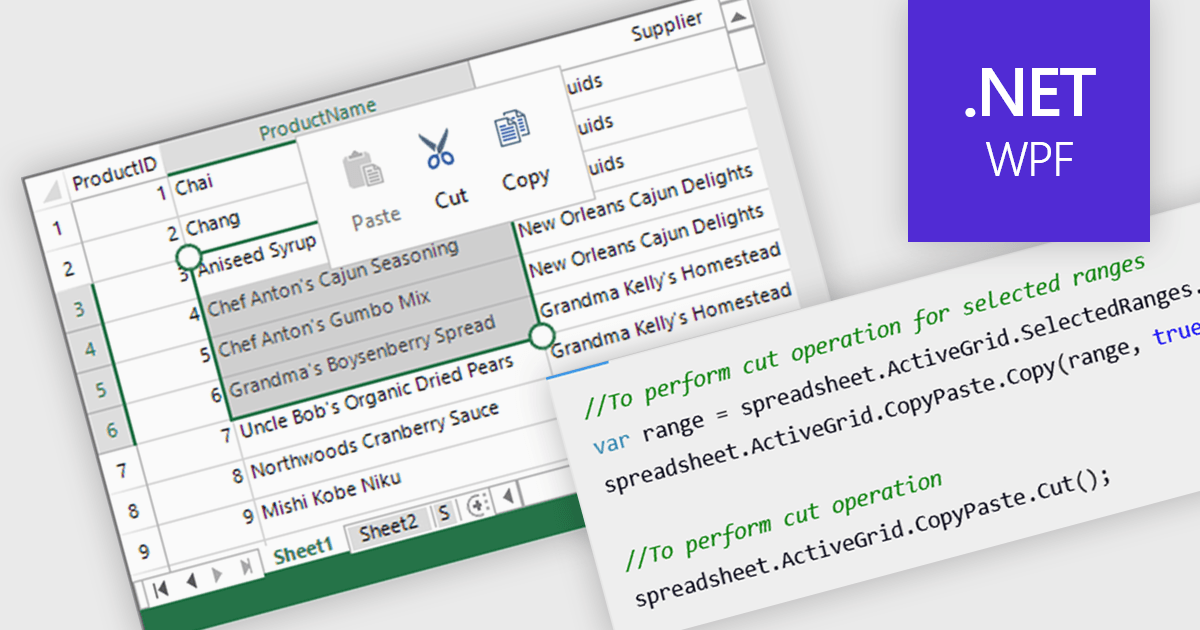
Clipboard operation support lets users copy, cut, and paste data between spreadsheet instances or other applications while maintaining structure and formatting. This functionality ensures seamless data transfer, improving efficiency in data manipulation tasks. Modern implementations often include support for multi-cell operations, rich text handling, and programmatic access through APIs, allowing developers to integrate clipboard interactions into their applications. Clipboard support enhances usability and improves overall productivity in spreadsheet-based applications.
Several .NET WPF spreadsheet controls offer clipboard operations, including:
For an in-depth analysis of features and price, visit our .NET WPF spreadsheet controls comparison.
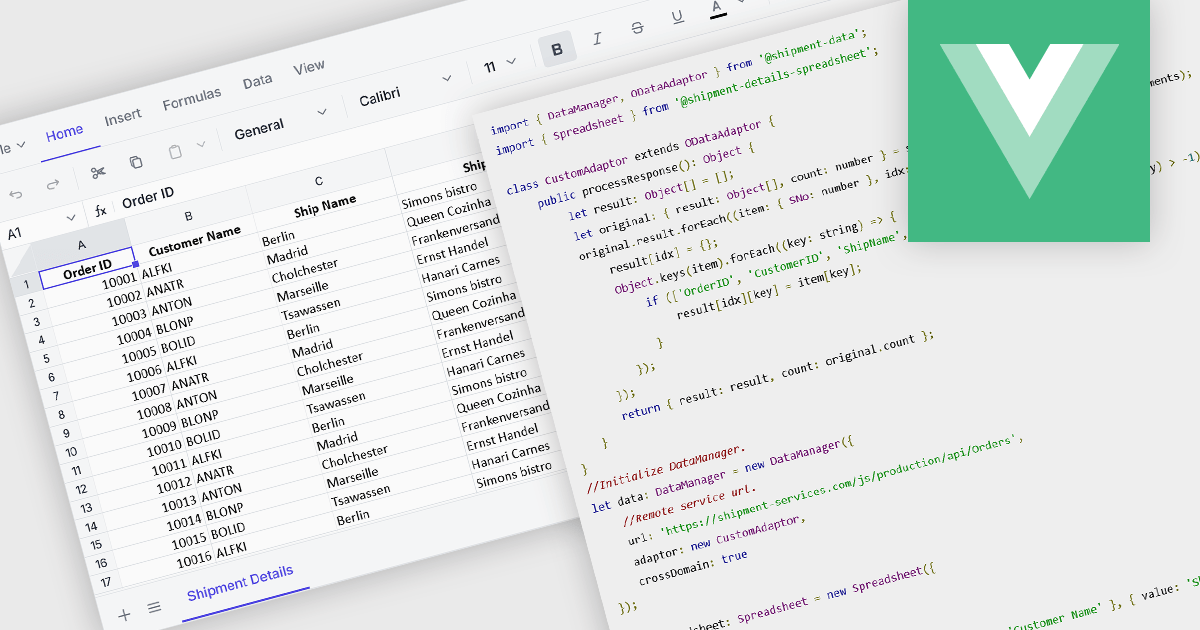
Data binding in a spreadsheet is the process of linking spreadsheet cells to external data sources, such as databases, APIs (Application Programming Interfaces), or other structured datasets, ensuring that the spreadsheet dynamically updates when the source data changes. This enables real-time synchronization, reducing manual data entry and minimizing errors. By automating data retrieval and updates, data binding enhances accuracy, supports complex calculations with live data, and improves efficiency, making it particularly useful for reporting, financial analysis, and business intelligence tasks. It also facilitates better collaboration by ensuring that all users work with the most current information, improving decision-making and overall productivity.
Several Vue.js spreadsheet components offer data binding functionality, including:
For an in-depth analysis of features and price, visit our Vue.js spreadsheet controls comparison.
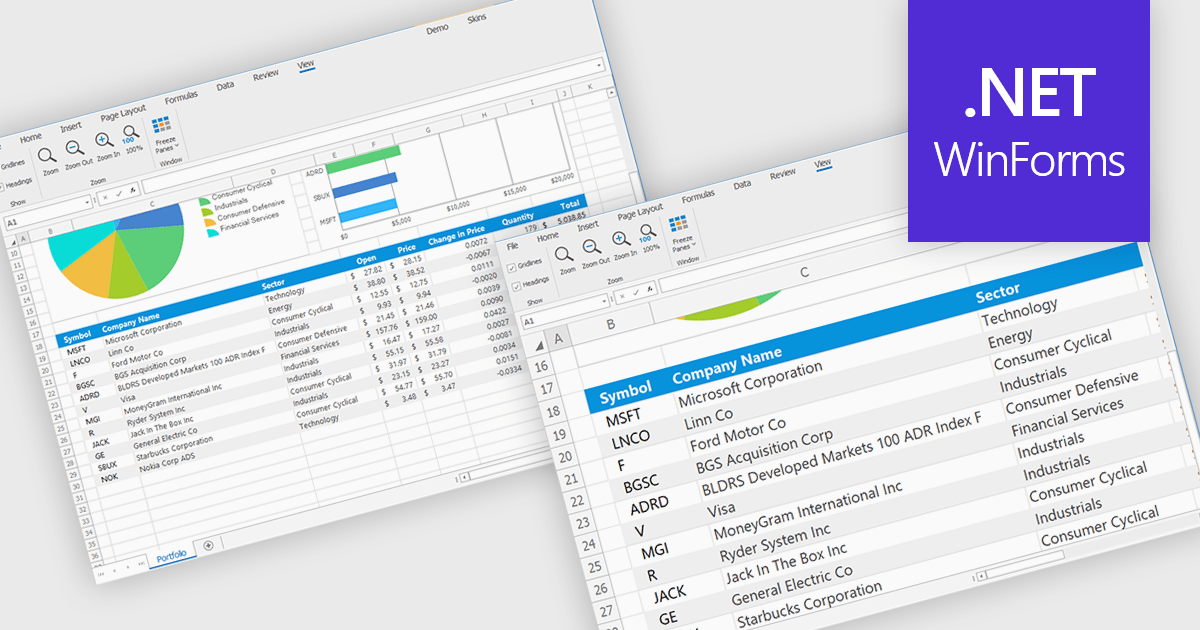
Zooming in a spreadsheet component refers to the ability to scale the displayed content, effectively increasing or decreasing the visible size of cells, data, and gridlines. This feature allows users to adjust the level of detail shown, enabling them to gain a broader overview or focus on specific data segments. Developers implement this to enhance user experience by providing flexibility in data visualization, improving accessibility for users with varying visual needs, and facilitating efficient data analysis through customized display levels.
Several WinForms spreadsheet controls offer support for zooming including:
For an in-depth analysis of features and price, visit our WinForms spreadsheets comparison.
Pivot tables provide a powerful way to analyze and summarize large datasets while preserving the original data. With advanced filtering, sorting, customizable views, and seamless chart integration, they streamline data analysis with ease. By organizing and visualizing information dynamically, pivot tables transform raw data into structured, interactive reports making it easier to uncover valuable insights and drive informed decisions.
Several .NET spreadsheet controls support pivot tables including:
For an in-depth analysis of features and price, visit our .NET spreadsheet controls comparison.
電話: (888) 850 9911
Fax: +1 770 250 6199


