


公式サプライヤー
公式および認定ディストリビューターとして200社以上の開発元から正規ライセンスを直接ご提供いたします。
当社のすべてのブランドをご覧ください。
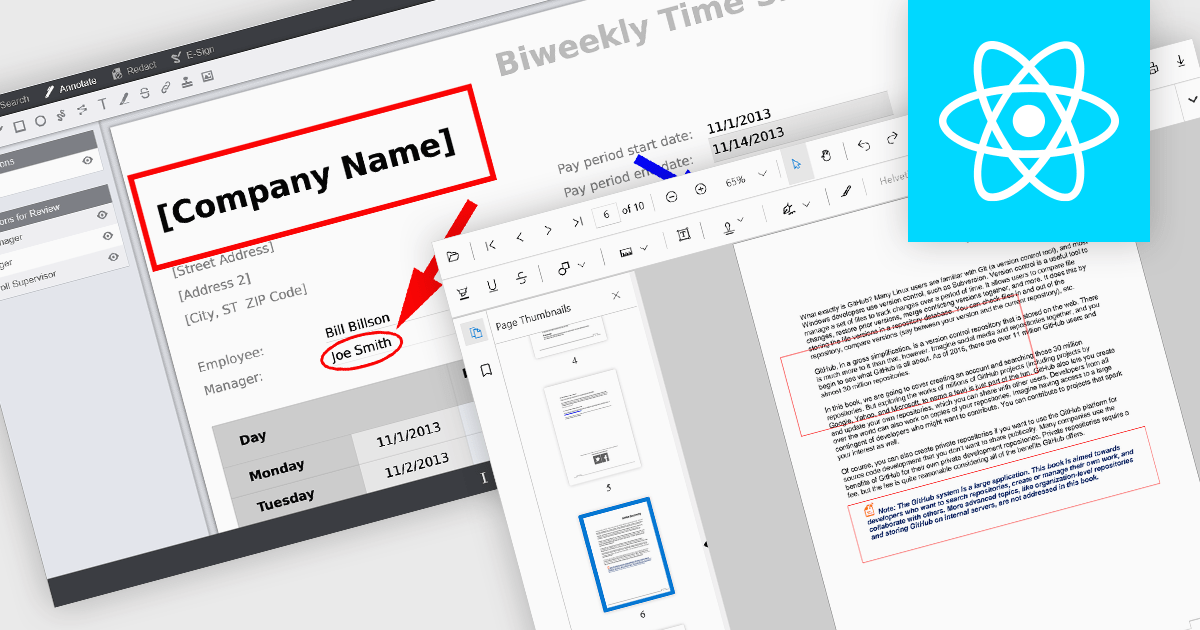
Rectangle annotations in PDF viewer components enable users to highlight, mark, or comment on specific areas within a PDF document by drawing rectangular shapes. This feature is commonly used for reviewing documents, collaborating on content, or emphasizing sections in technical or legal workflows. It enhances user interactivity within the viewer, allowing for visual references and context-specific notes without altering the original document content.
Several React PDF viewer controls offer rectangle annotations including:
For an in-depth analysis of features and price, visit our React PDF viewer controls comparison.
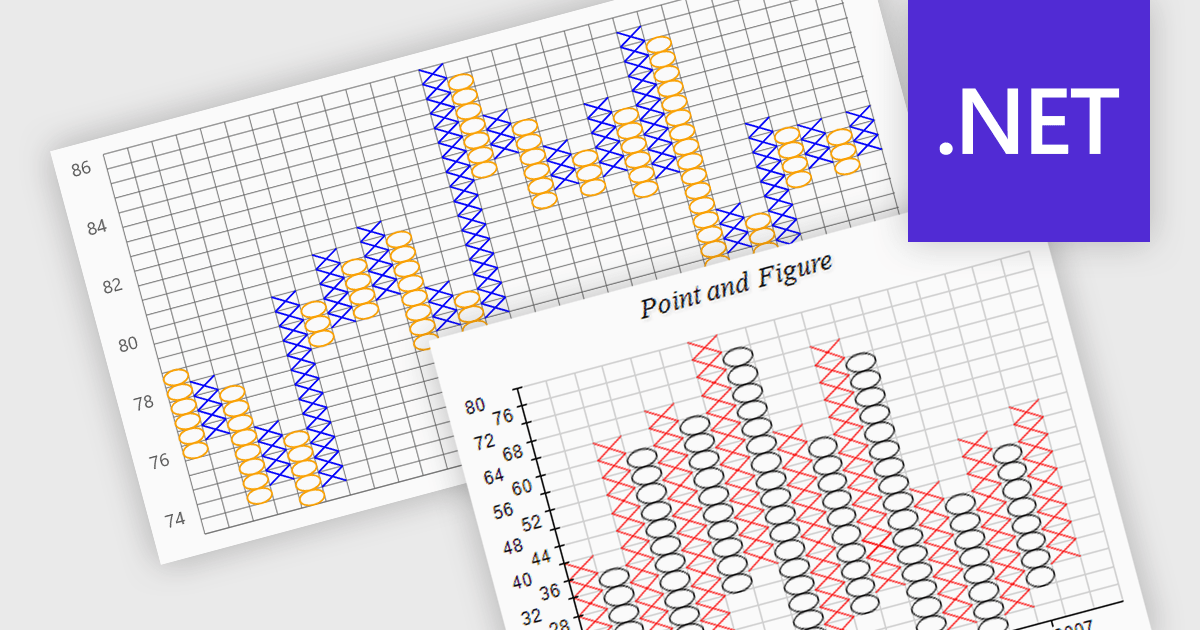
A point and figure (P&F) chart is a financial charting technique used to track price movements by plotting directional changes in price without reference to time. It focuses exclusively on significant price changes, filtering out minor fluctuations to highlight clear trends and reversals. Instead of plotting prices continuously, it uses columns of Xs and Os to represent rising and falling prices, respectively, based on predefined price increments. This chart type provides a straightforward view of supply and demand dynamics, making it particularly effective for identifying support and resistance levels, breakout patterns, and trend direction. Its simplicity helps traders and analysts focus on essential price action, reducing the noise found in traditional time-based charts.
Several .NET charting components provide you with point and figure charts, including:
For an in-depth analysis of features and price, visit our comparison of .NET chart components.
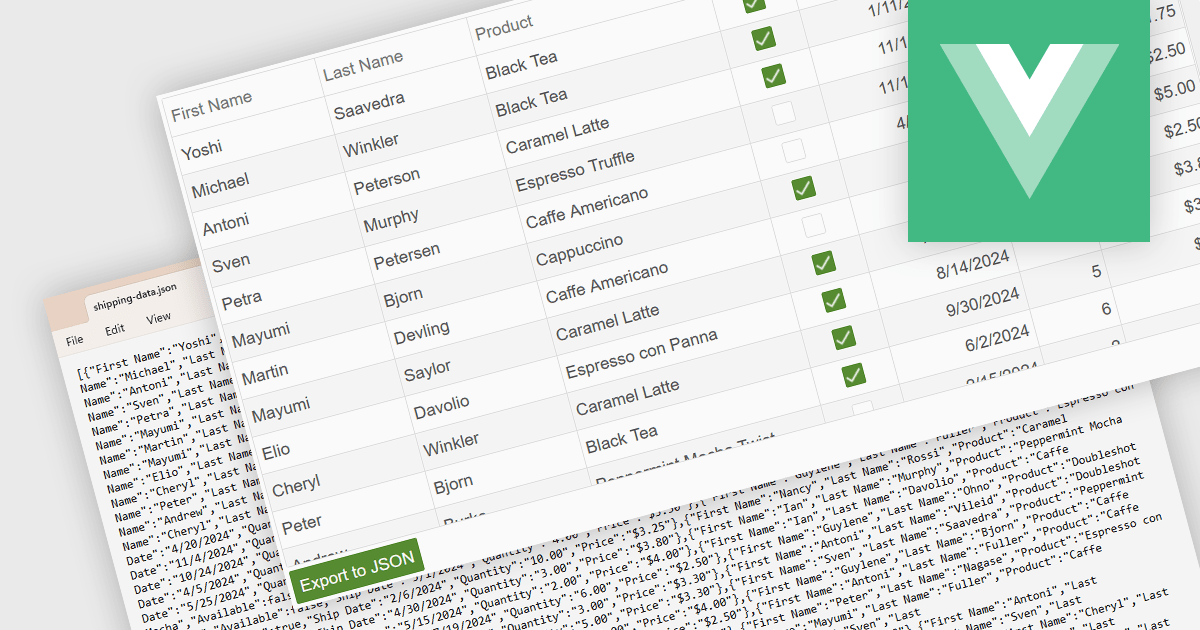
Exporting a data grid to JSON format is a common feature in modern web-based data tools that involves converting the structured data displayed in a grid, such as rows and columns representing records and fields, into JavaScript Object Notation (JSON), a lightweight, text-based format commonly used for data interchange. This process enables the grid's contents to be saved in a machine-readable structure that preserves the hierarchy and attributes of the data, making it easily consumable by web services, APIs, or other applications. The benefits of exporting to JSON include its compatibility with a wide range of programming environments, ease of integration with frontend and backend systems, and suitability for transmitting data across networked systems or persisting it for later use in client-side operations or remote storage.
Several Vue.js grid controls allow you to export to JSON, including:
For an in-depth analysis of features and price, visit our comparison of Vue.js grid controls.
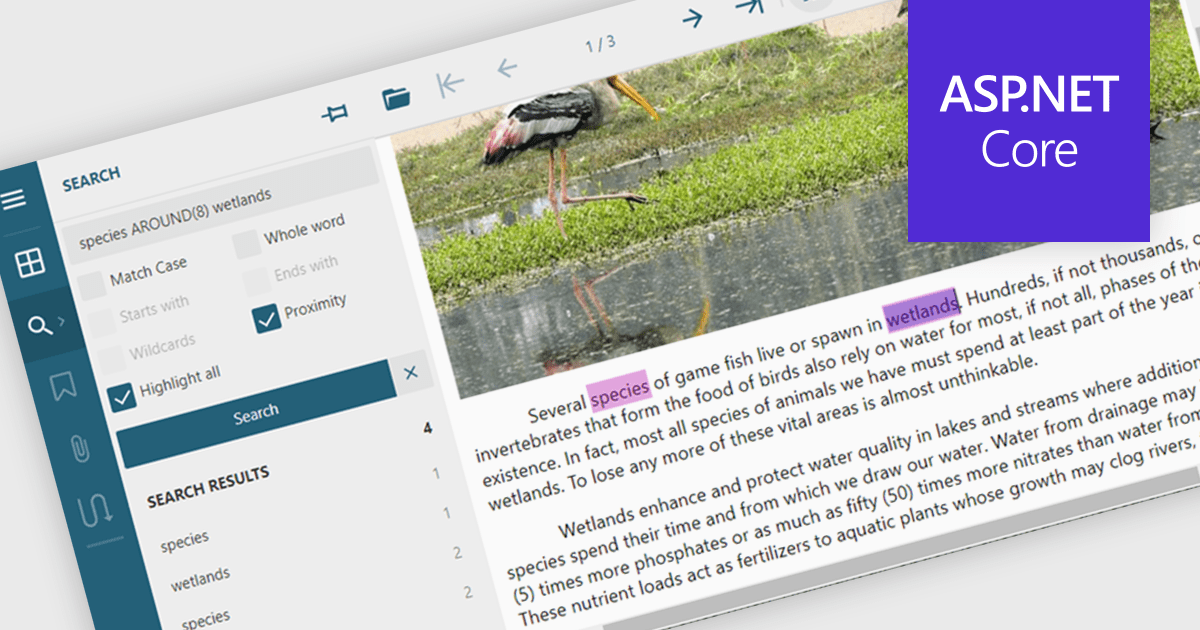
Text searching in a PDF component refers to the ability to programmatically locate and extract text within a PDF document based on specific search criteria. This functionality typically supports case sensitivity, whole word matching, and regular expressions, enabling precise querying across pages or document sections. For developers, it facilitates building features such as keyword highlighting, document indexing, content validation, and automated redaction workflows. By integrating text search, applications can efficiently interact with PDF content without manual review, saving time and improving data accessibility and accuracy across business and document automation systems.
Several ASP.NET Core PDF components allow you to search for text within a PDF file, including:
For an in-depth analysis of features and price, visit our comparison of ASP.NET Core PDF components.
Skyvia Data Integration is a cloud-based platform that provides a unified environment for managing data pipelines, ETL processes, and data synchronization between various data sources and destinations. It offers a low-code interface for creating and configuring data integration workflows, automating routine tasks, and ensuring data consistency across different systems. The platform supports a wide range of data formats and protocols, including relational databases, MySQL databases, cloud storage, and APIs, making it a versatile tool for data professionals and developers.
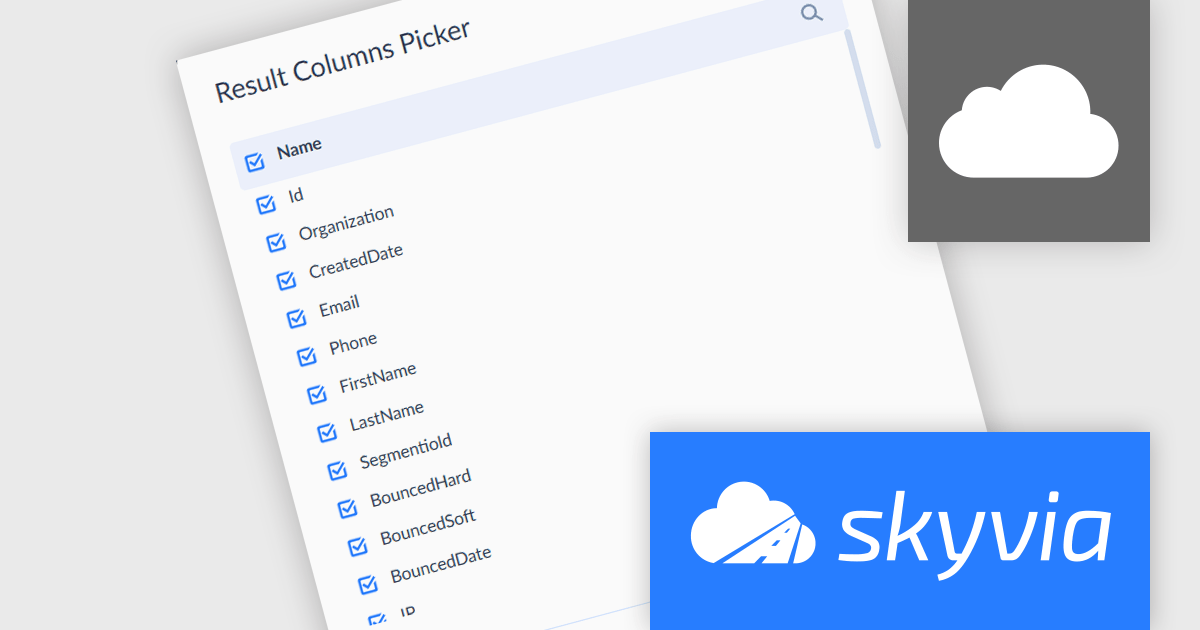
The latest Skyvia Data Integration release adds a new Result Columns Picker for Lookup components, providing a convenient way to select the desired fields with checkboxes. This reduces unnecessary data transfer and simplifies downstream transformations. By focusing only on essential fields, integration jobs become leaner, faster, and easier to understand and maintain. The Result Columns Picker minimizes clutter in workflows and improves performance, especially in high-volume or multi-step data processes, making data integration more efficient and transparent for development teams.
To see a full list of what's new, see our release notes.
Skyvia Data Integration is licensed based on the number of records processed per month and is available as an Annual License. See our Skyvia Data Integration licensing page for full details.
Learn more on our Skyvia Data Integration product page.
電話: (888) 850 9911
Fax: +1 770 250 6199


