


公式サプライヤー
公式および認定ディストリビューターとして200社以上の開発元から正規ライセンスを直接ご提供いたします。
当社のすべてのブランドをご覧ください。
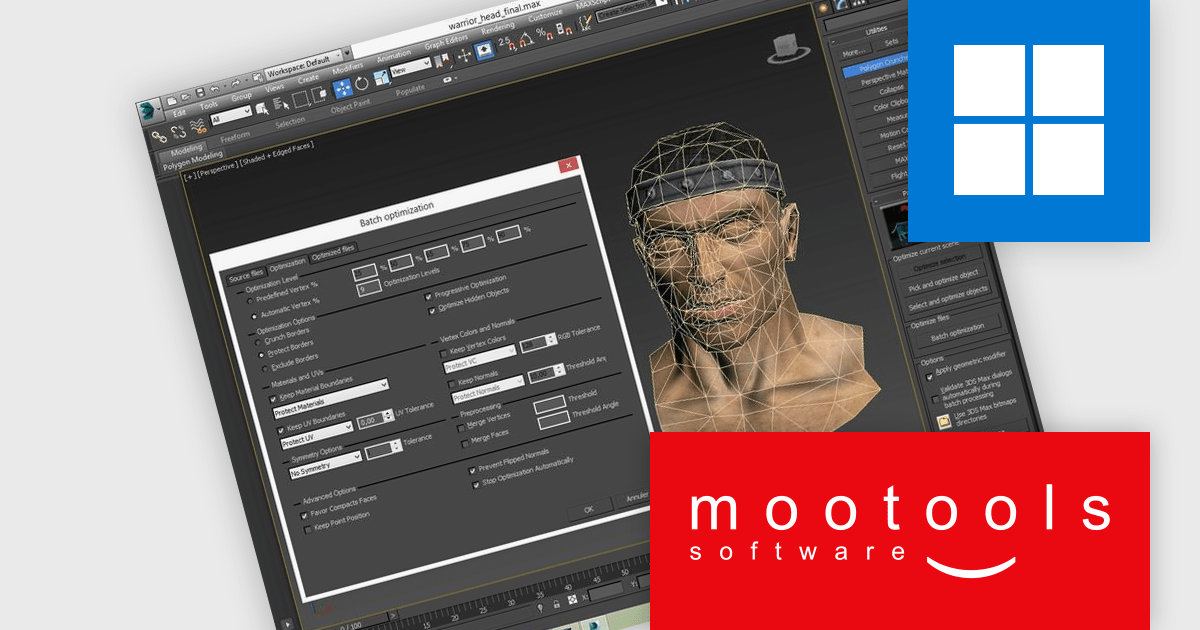
Polygon Cruncher is a high-performance 3D mesh optimization tool designed to simplify complex models across industries such as architecture, video games, CAD, 3D printing, and historical 3D scanning. It uses an advanced algorithm refined over 20 years to efficiently reduce polygon counts in meshes with millions of polygons while preserving visual quality. Available as plugins for 3DS Max, Maya, and Lightwave, as well as a command line version, it integrates seamlessly into various 3D production pipelines for both interactive and automated workflows.
Mootools Polygon Cruncher empowers developers to optimize 3D assets at scale through batch automation, allowing for faster processing of multiple models with minimal manual input. It intelligently reduces polygon counts while maintaining essential attributes such as UVs and normals, ensuring that asset integrity and visual quality are preserved throughout the pipeline. This capability makes it ideal for high-volume production environments where efficiency, consistency, and performance are critical.
Polygon Cruncher is licensed per workstation and is available as a perpetual or subscription license. Visit our Polygon Cruncher Licensing page for full details.
Learn more on our Polygon Cruncher product page.
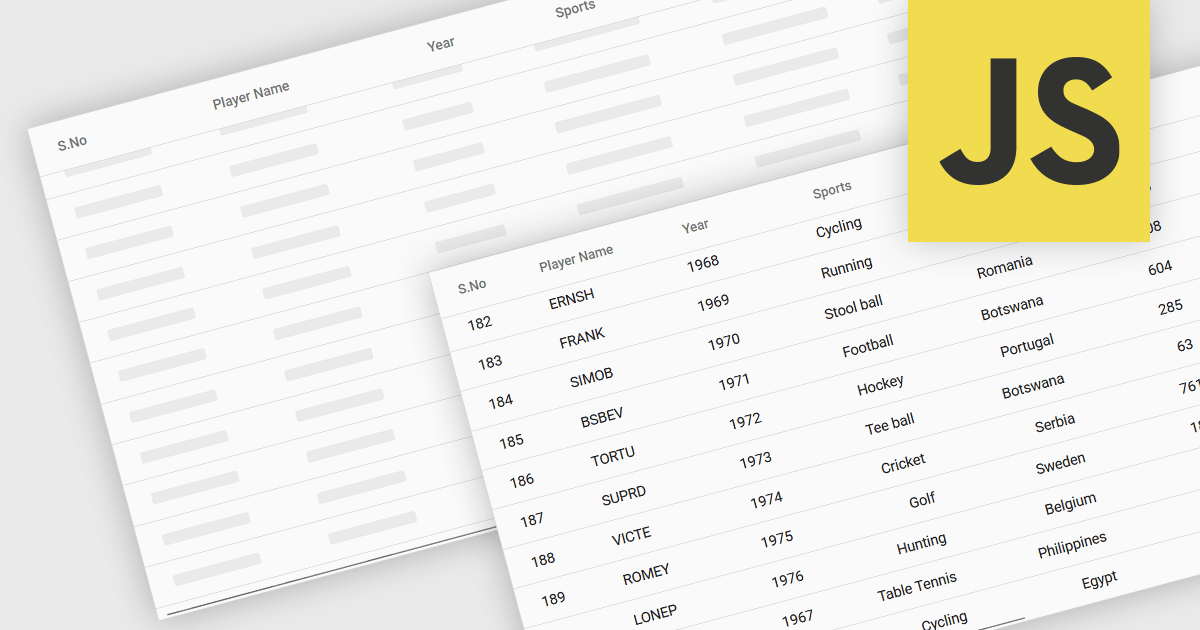
The ability to load items in a data grid as you scroll is a technique where content is rendered or fetched dynamically based on the user’s scroll position. Its purpose is to improve performance, and ultimately the user experience, when dealing with large datasets. This includes virtual scrolling, where the grid only renders rows that are currently visible in the viewport and reuses those same DOM elements as the user scrolls, and infinite scrolling (also known as endless scrolling), where additional data is loaded from a remote source in response to reaching the end of the currently displayed dataset. By minimizing the amount of data rendered or retrieved at any one time, this approach significantly reduces initial load times, improves responsiveness, and allows applications to scale efficiently.
Several JavaScript grid components allow you to load items as the user scrolls, including:
For an in-depth analysis of features and price, visit our comparison of JavaScript grid components.
Since 2024, ComponentSource and Skyvia have partnered to provide developers with powerful cloud data tools that simplify integration, backup, and data management workflows. This collaboration enhances ComponentSource’s product portfolio with modern, no-code solutions designed for today’s data-driven applications.
Skyvia’s suite includes cloud-based tools for data integration, backup, query, and connectivity, allowing users to connect platforms such as Salesforce, Google BigQuery, and MySQL without the need for coding. These tools are ideal for developers and teams aiming to automate workflows, protect data, and maintain real-time synchronization across systems.
Through this partnership, ComponentSource is better equipped to meet the growing demand for cloud-native solutions, offering customers scalable, user-friendly tools that reduce development time and complexity. Skyvia’s addition reinforces ComponentSource’s commitment to delivering high-quality, developer-focused technologies that support digital transformation efforts.
Learn more on our Skyvia brand page.
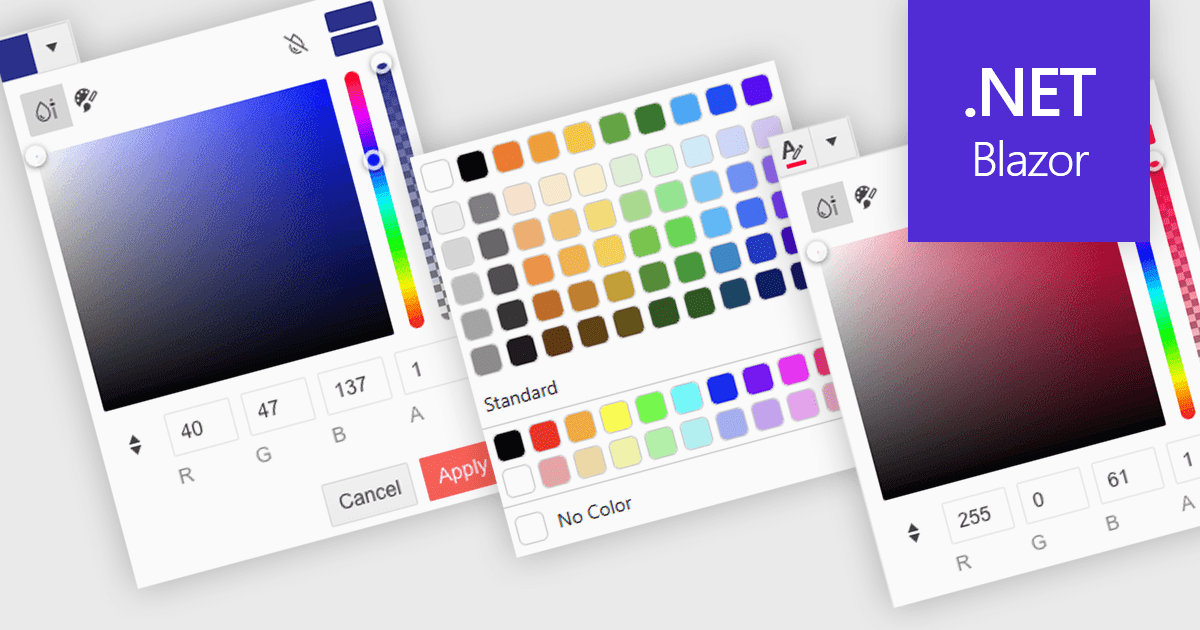
A color picker is a user interface element that allows users to choose and apply colors to specific parts of their data without writing any code. It typically appears as a small palette or input box that, when clicked, opens a panel with color options like swatches, sliders, or hex code fields. This feature supports intuitive visual customization, enabling users to highlight patterns, mark important values, or align with corporate color schemes. In advanced editors, color pickers also support themes or accessibility settings, such as high-contrast palettes.
Several .NET Blazor data editors can provide you with a color picker, including:
For an in-depth analysis of features and price, visit our .NET Blazor data editors comparison.
Telerik Document Processing is a suite of document processing libraries designed for web, desktop and cross-platform .NET applications. It enables developers to create, read, edit, and convert a wide range of document formats, including PDF, DOCX, XLSX, ZIP and HTML, without relying on external software such as Microsoft Office or Adobe Acrobat. These libraries are independent from the user interface (UI) and are built for high performance and accuracy, providing convenient APIs that give flexibility and control so you can integrate document processing capabilities into your applications with only a few lines of code.
The Telerik Document Processing Libraries 2025 Q2 (2025.2.520) update adds Optical Character Recognition (OCR) support to the PDFProcessing library, enabling developers to extract machine-readable text from scanned PDFs and images directly within .NET applications. This functionality facilitates the conversion of previously inaccessible content, such as scanned contracts, forms or handwritten notes, into editable and searchable machine-encoded text, providing users with extracted text along with a PDF containing the image with selectable text. By integrating OCR capabilities, developers can now streamline data extraction and analysis tasks, reducing the need for manual data entry and improving overall efficiency in handling diverse document types.
To see a full list of what's new in 2025 Q2 (2025.2.520), see our release notes.
Telerik UI is licensed per developer and has two licensing models: an annual Subscription License and a Perpetual License. The Subscription license provides access to the latest product updates, technical support, and exclusive benefits for a flat annual fee, and must be renewed to continue using the software. The Perpetual license is a one-time purchase granting access to the current released version and includes a one-year subscription for product updates and technical support. After this initial period, users can choose to renew the subscription element to continue receiving updates and support; otherwise, they may continue using the installed version available during their active subscription term but will forgo future updates and support. See our Telerik DevCraft Ultimate licensing page for full details.
The Telerik Document Processing Libraries are available in the following products:
電話: (888) 850 9911
Fax: +1 770 250 6199


