


公式サプライヤー
公式および認定ディストリビューターとして200社以上の開発元から正規ライセンスを直接ご提供いたします。
当社のすべてのブランドをご覧ください。
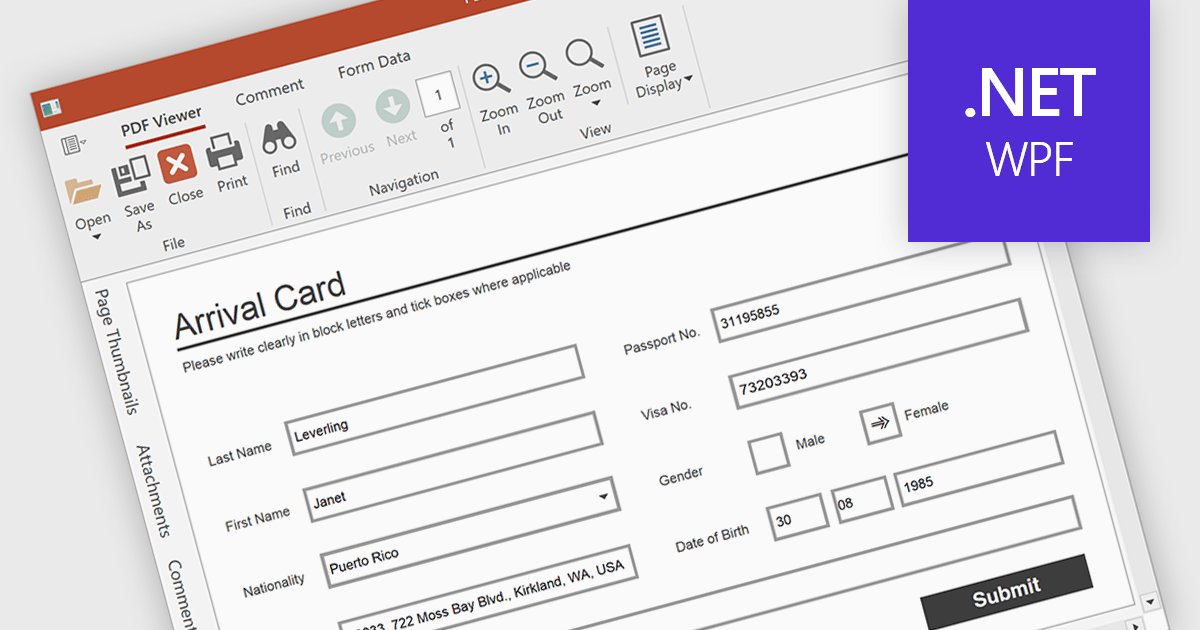
Form filling in a PDF Viewer enables users to interact with editable fields such as text boxes, checkmarks, radio buttons, and selection lists - right inside the document. This functionality is ideal for scenarios like contracts, surveys, and registration forms, where structured input is essential. By integrating these capabilities, developers can improve user interactions and allow form submission without leaving the application, enhancing data capture and eliminating the need for external tools.
Several WPF PDF Viewers feature support for form filling, including:
For an in-depth analysis of features and price, visit our comparison of WPF PDF viewers.
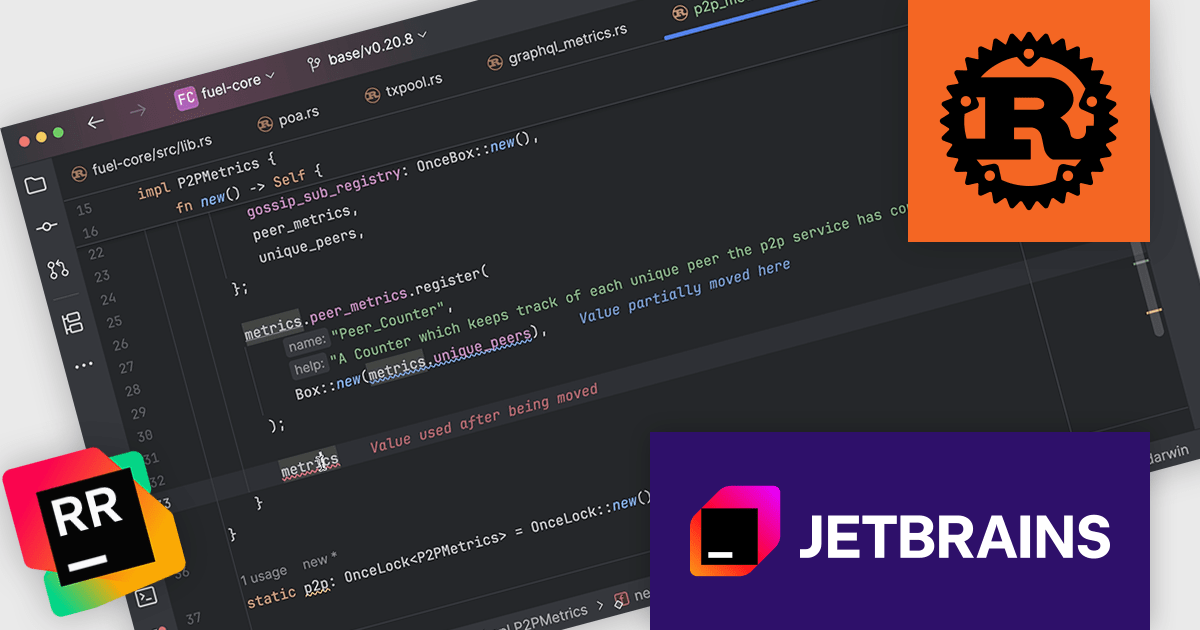
RustRover by JetBrains is a specialized integrated development environment (IDE) designed to support the unique needs of Rust developers. Built on JetBrains' IntelliJ platform, it combines deep language understanding with tools that enhance productivity, such as intelligent code completion, advanced code analysis, and robust refactoring capabilities. RustRover also integrates seamlessly with Cargo, Rust's package manager, and includes built-in support for testing and debugging to streamline the entire development workflow. By focusing on the requirements of performance-critical and memory-safe applications, RustRover helps developers write efficient, reliable, and maintainable Rust code with ease.
JetBrains has added a valuable update to RustRover with the introduction of color-coded inlay error descriptions. This feature adds concise error explanations directly in the code editor whenever the caret is positioned within an error's range. What sets this apart is the use of consistent color schemes that reflect different levels of severity, enabling developers to quickly distinguish between warnings, errors, and other diagnostics. This visual feedback simplifies error identification and supports faster debugging and code correction.
RustRover is licensed per user, and is available as a commercial annual subscription license. We can supply new subscriptions, subscription renewals, lapsed renewals, and additional user licenses. See our RustRover licensing page for full details.
RustRover is available to buy in the following products:
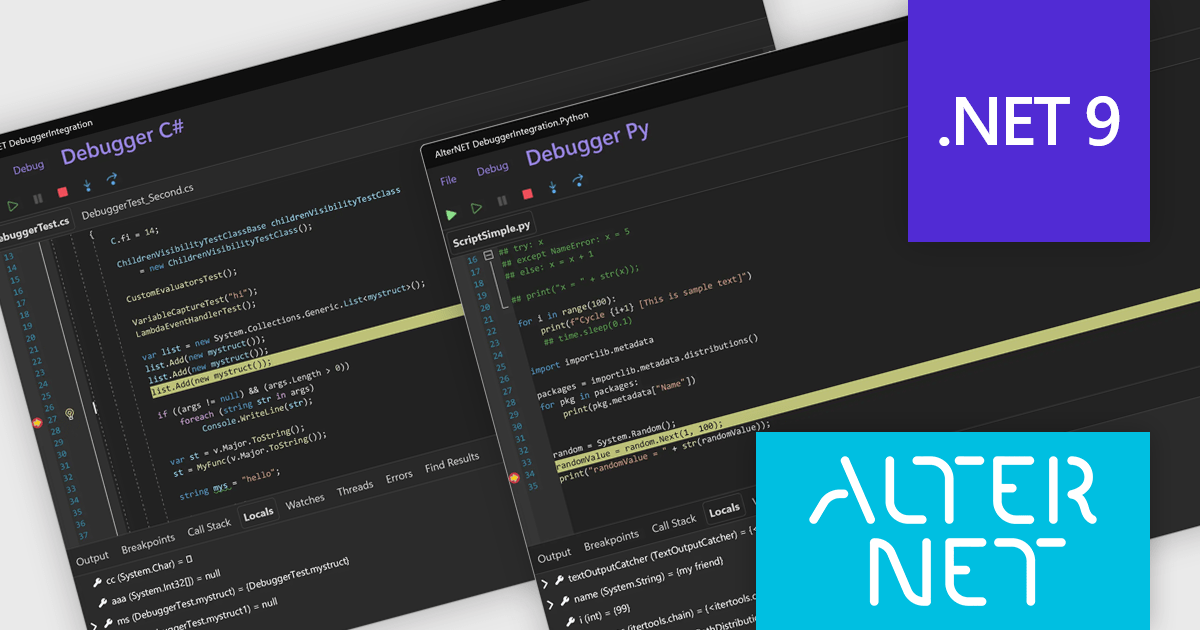
AlterNET Studio is a development toolkit designed specifically for .NET developers building Windows Forms or WPF applications. It provides a suite of components that integrate seamlessly into your applications, offering functionalities like advanced code editing with features akin to Microsoft Visual Studio, scripting capabilities in various languages for extending application logic, and a visual form designer for crafting user interfaces.
The AlterNET Studio v10 update introduces compatibility for C#, Visual Basic, and Python scripters and debuggers with macOS and Linux, allowing developers to build and debug cross-platform applications without being restricted to a Windows environment. By targeting .NET Standard 2.0, the non-visual components such as scripting engines and parsers are now usable across a broader range of platforms. Additionally, the inclusion of a debugger UI built with AlterNET UI and MAUI enables integration of modern, customizable debugging interfaces into cross-platform applications, improving development and enhancing productivity in multi-OS environments.
To see a full list of what's new in v10, see our release notes.
AlterNET Studio is licensed per developer. A license is only required when developing and compiling applications that use AlterNET Studio; end-users or testers of compiled applications do not require a license. The perpetual license includes a one-year subscription which entitles you to free updates to all new versions during the subscription period. See our AlterNET Studio licensing page for full details.
Learn more on our AlterNET Studio product page.
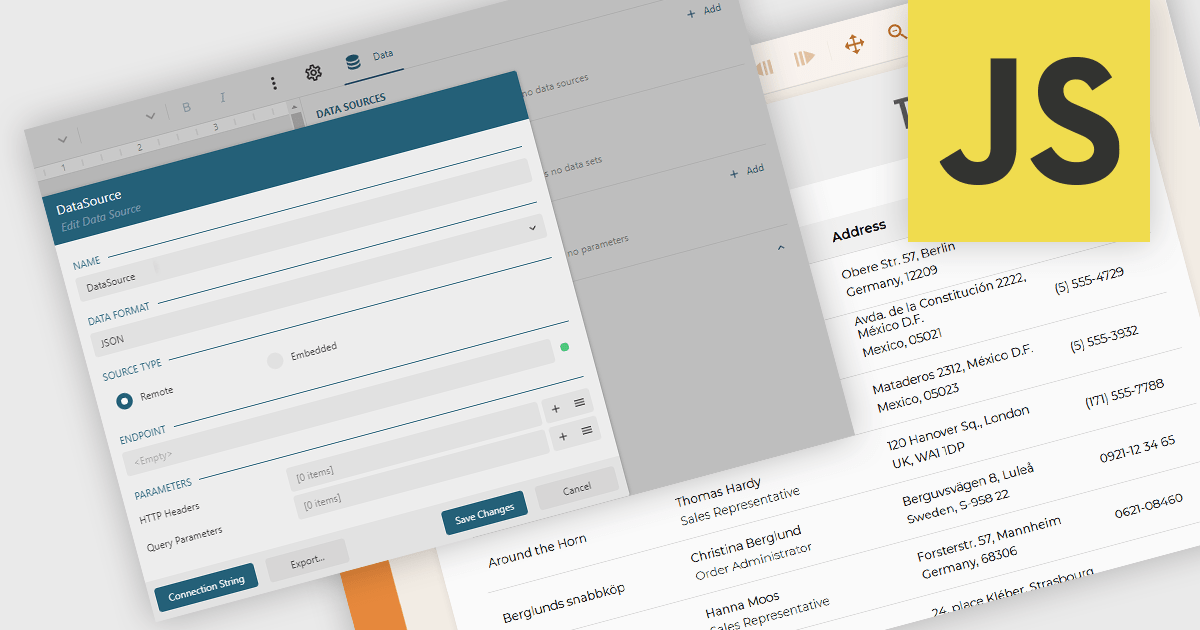
JSON data connectivity in reporting components provides the ability to use JSON (JavaScript Object Notation) data as a primary source for building and generating reports. This feature allows developers and analysts to connect directly to structured JSON data, whether from local files or web APIs, and incorporate it into report designs without the need for complex data transformation or intermediary storage. As JSON has become a widely adopted format for data exchange in modern applications, enabling direct connectivity simplifies the reporting process and ensures that reports can easily reflect up-to-date information from diverse and distributed sources.
Several JavaScript reporting components allow you to use JSON as a data source, including:
For an in-depth analysis of features and price, visit our comparison of JavaScript reporting components.
SurveyJS is a family of extensible JavaScript libraries designed to help developers build robust form management systems fully integrated into their web applications. These libraries work seamlessly with any backend system and are fully compatible with modern JavaScript frameworks, including React, Angular, and Vue.
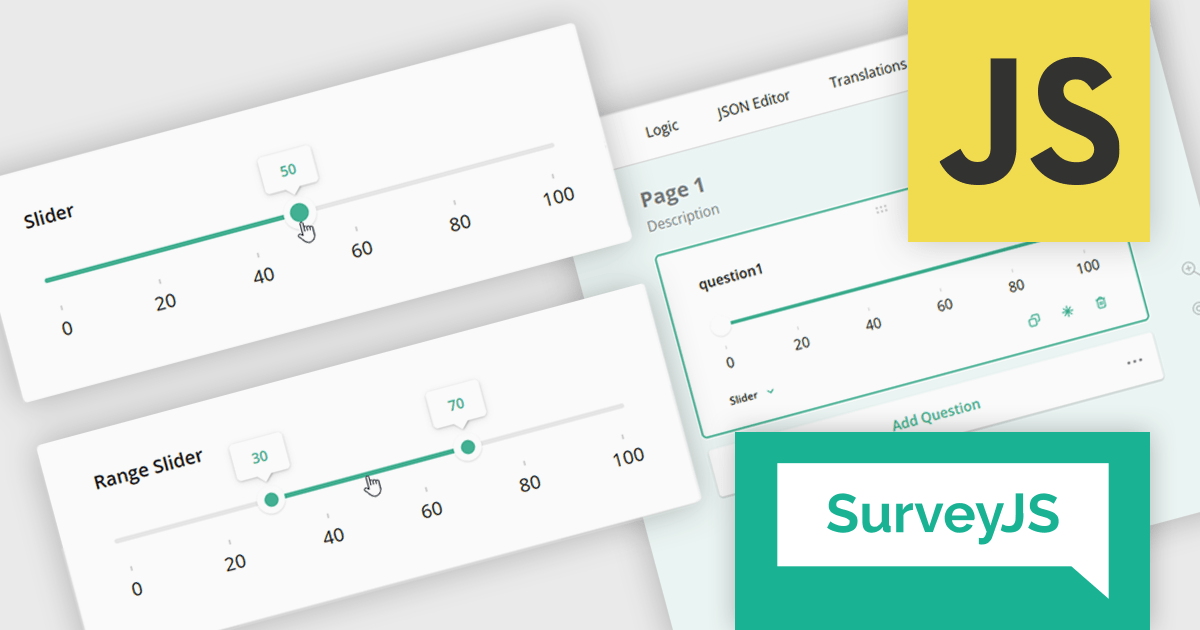
The SurveyJS 2.2.0 update introduces new Slider and Range Slider question types that enable developers to implement more interactive and precise input mechanisms within surveys. These components support a wide range of configuration options, including customizable minimum and maximum values, step sizes, labeled scales, and tooltip formatting. The Range Slider further enhances flexibility by allowing respondents to select and drag a value range using dual thumbs, with optional constraints on range length. Both question types can be seamlessly bound to text input fields, offering a more responsive and accessible data collection experience in custom survey workflows.
To see a full list of what's new in version 2.2.0, see our release notes.
SurveyJS is licensed per developer with a one-time payment for indefinite use. Access to updates and technical support is available through a subscription. See our SurveyJS Survey Creator licensing page for full details.
Learn more on our SurveyJS Survey Creator product page.
電話: (888) 850 9911
Fax: +1 770 250 6199


