


公式サプライヤー
公式および認定ディストリビューターとして200社以上の開発元から正規ライセンスを直接ご提供いたします。
当社のすべてのブランドをご覧ください。
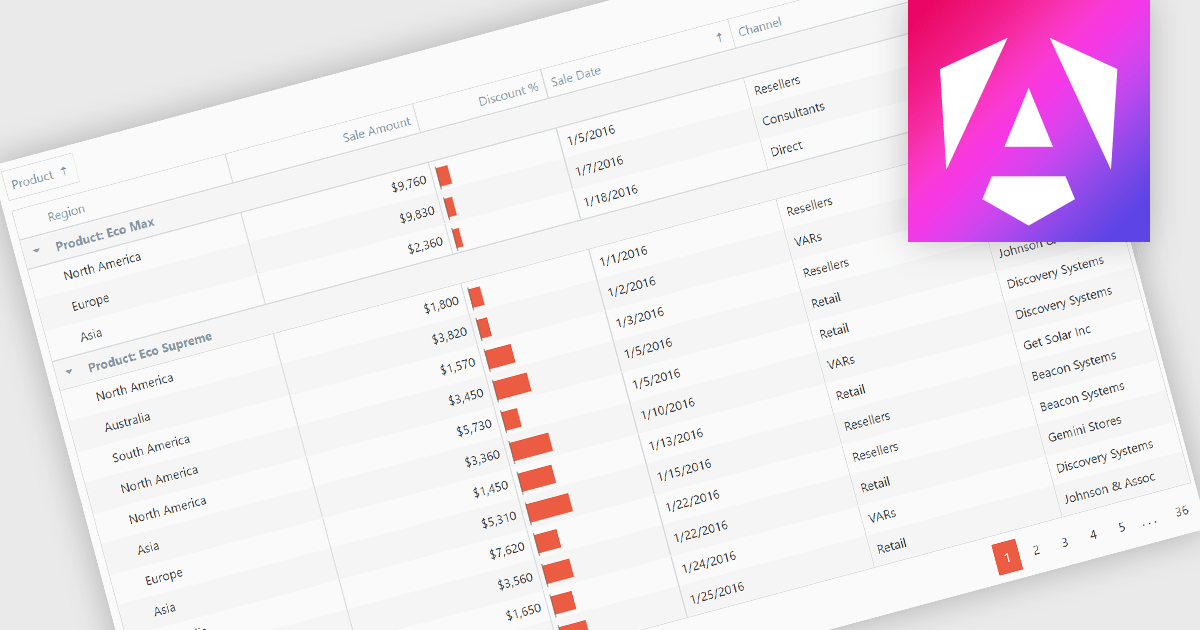
Grouping grid data organizes the data into distinct groups within a grid-like structure. It involves visually clustering related data points together, often using color, shading, or borders, to enhance pattern recognition and make complex datasets more understandable. This method is useful for identifying trends, outliers, and correlations within large amounts of information.
Several Angular grid controls offer support for grouping including:
For an in-depth analysis of features and price, visit our Angular grid controls comparison.
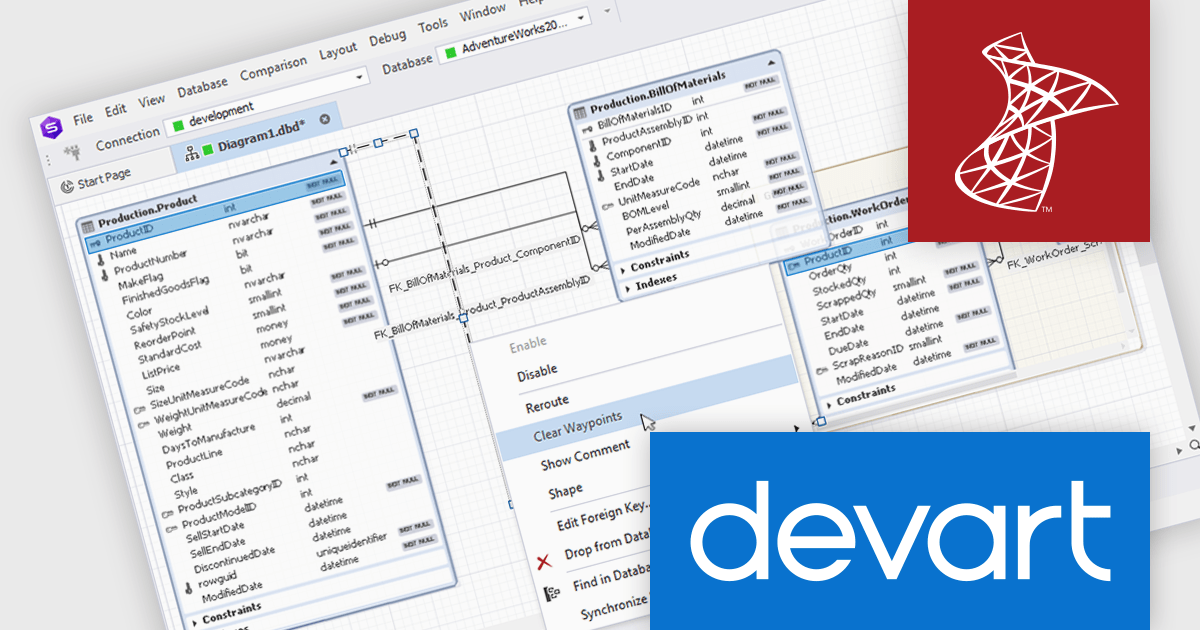
dbForge Studio for SQL Server is a comprehensive SQL Server management tool designed to enhance productivity and efficiency for database professionals. It offers a rich feature set including SQL editing and debugging, database schema design, data comparison and synchronization, performance optimization tools, and integration with source control systems. This software empowers developers and administrators to manage their SQL Server databases effectively, streamline development processes, and ensure data integrity.
The dbForge Studio for SQL Server V7.0.158 release adds new options for database diagrams. "Select All Relations" enables users to quickly select all relationships within a diagram for batch editing or analysis, saving time and effort. Conversely, "Clear Waypoints" allows for the efficient removal of manually created waypoints, enhancing diagram clarity and reducing visual clutter. These features streamline database design and modification processes, increasing productivity.
To see a full list of what's new in V7.0.158, see our release notes.
dbForge Studio for SQL Server is licensed per developer and is available as an Annual or Perpetual License with a 12 month support and maintenance subscription. See our dbForge Studio for SQL Server licensing page for full details.
dbForge Studio for SQL Server is available in the following products:
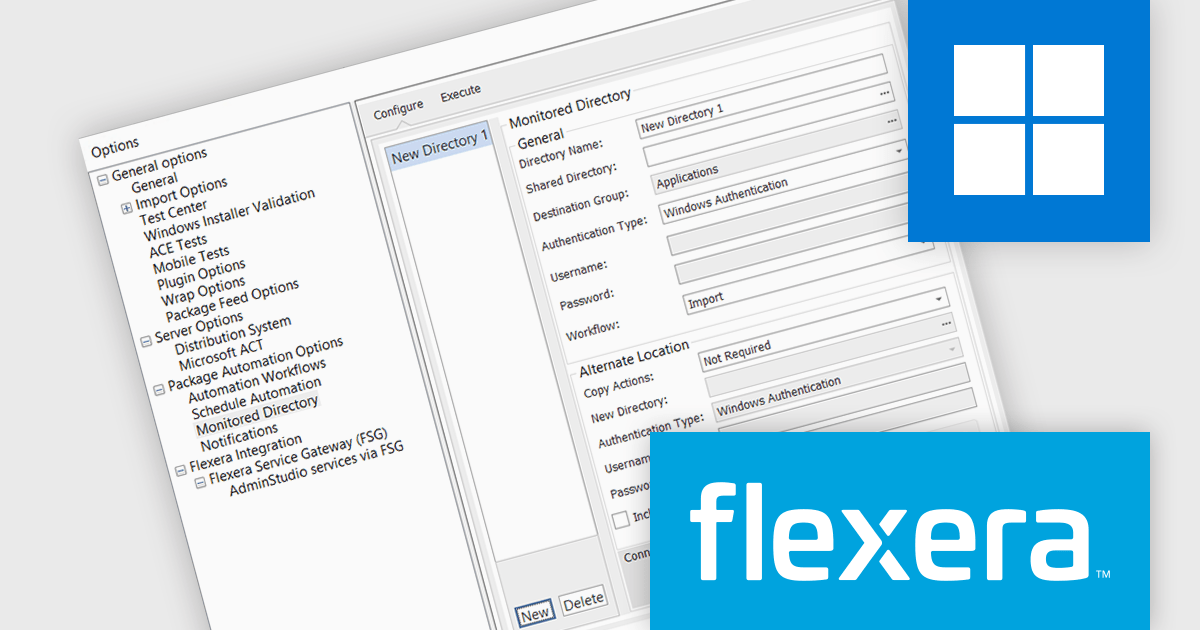
AdminStudio, by Flexera, empowers IT teams to seamlessly and securely package and deploy applications across various platforms. This comprehensive suite automates key processes, from building new packages to testing compatibility and mitigating risks, ensuring efficient and reliable software distribution within your organization. Whether managing physical or virtual applications, AdminStudio simplifies the entire journey, from initial packaging to endpoint delivery, ultimately driving greater efficiency and minimizing deployment risks.
The AdminStudio 2024 R2 release introduces an "Alternate Location" section within the Monitored Directory, designed to streamline and optimize the management of application imports for package automation. This new feature allows administrators to configure an alternate location where applications can be copied or moved directly from a Shared Directory to a designated New Directory. Once in the New Directory, these applications are readily available for import, significantly simplifying the workflow for package automation.
To see a full list of what's new in version 2024 R2, see our release notes.
AdminStudio is licensed per user and is available as a 3 Year Timed Subscription. See our AdminStudio Professional or AdminStudio Enterprise licensing pages for full details.
For more information, visit our product pages:
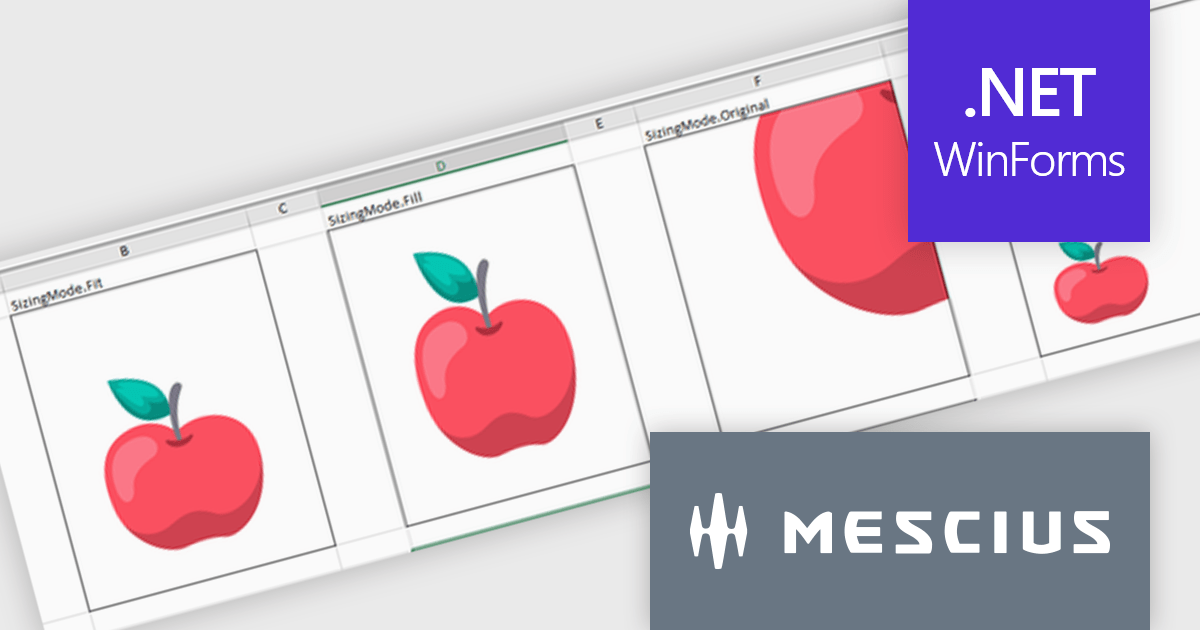
Spread.NET by MESCIUS is a powerful tool for building Excel-like applications in your .NET projects. It lets you create interactive spreadsheets, grids, dashboards, and even forms within WinForms, ASP.NET, and WPF applications. With its rich feature set, including a robust calculation engine, formula support, and Excel compatibility, Spread.NET empowers developers to build data analysis tools, budgeting apps, scientific dashboards, and more, all within the familiar .NET environment.
The Spread.NET v17.2 release introduces greater cell image versatility and customization. With four new distinct sizing options—Fit, Fill, Original, and Custom—users gain precise control over how images are displayed within cells. The Fit mode maintains the image's aspect ratio while ensuring it fits within the cell, preventing distortion. The Fill option covers the entire cell, disregarding the aspect ratio for full coverage. Original preserves the image's natural size, even if it exceeds the cell's dimensions, while Custom allows users to set specific height and width parameters. These flexible sizing options enhance the presentation of images, offering tailored solutions to fit various content needs, whether it’s for data visualization, design, or reporting purposes. This feature significantly improves visual control, ensuring consistency and a professional appearance across documents.
To see a full list of what's new in v17.2, see our release notes.
Spread.NET is licensed per developer and is available as a Perpetual License with a 12 month support and maintenance subscription. We can supply any Spread.NET license including new licenses, maintenance renewals, and upgrade licenses. See our Spread.NET licensing page for full details.
For more information, visit our Spread.NET product page.
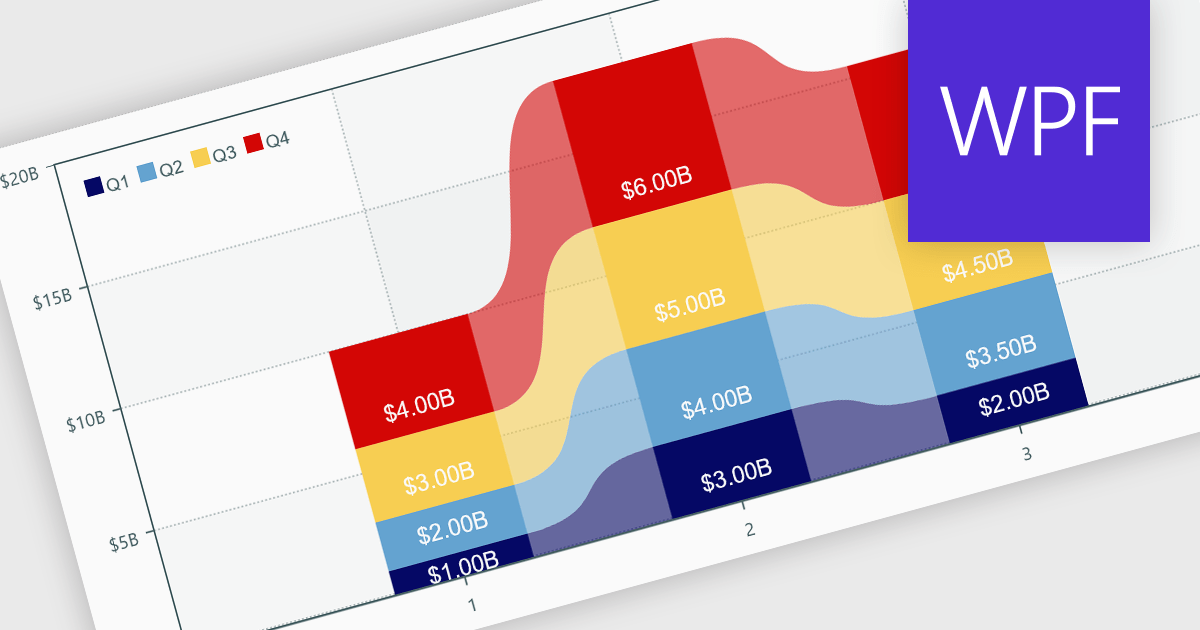
Charts within reports are graphical representations of data that allow users to visually interpret trends, comparisons, and patterns. They can take various forms, such as bar charts, line charts, or pie charts, and are typically integrated into dashboards or reporting tools to provide clear insights at a glance. By simplifying data visualization, charts enhance user experience and make it less taxing for users to understand complex information. Charts can be dynamically updated with real-time data, allowing for more responsive and insightful reporting in applications.
Several .NET WPF reporting controls offer support for charts including:
For an in-depth analysis of features and price, visit our comparison of .NET WPF Reporting controls.
電話: (888) 850 9911
Fax: +1 770 250 6199


