機能
- New Wizards for Creating Reports - New report wizards have been added that allow you to create Invoices, Orders and Quotes. After creating the report, you can edit the template in the report designer.
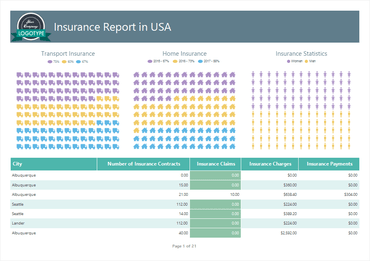
- Pictorial Chart - To visualize the values in this chart, various icons are used. For each row of the chart, you can specify an icon.
- Mobile Mode for HTML5 Viewer - In this release, the HTML5 viewer has been adapted to work on mobile devices. You can now view reports and export them directly from your mobile device.
- Settings in the Data Dictionary - All data dictionary settings are now shown in a separate menu.
- Report Designer Notification Menu - Allows you to see information about the release of new versions, as well as expiration of your Stimulsoft subscription.
JavaScript用の使いやすいレポートジェネレータ

2008に公式ディストリビューターとして登録
