機能
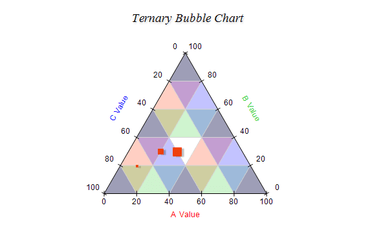
- New Ternary Chart Type - A Ternary chart plots three variables which sum to a constant.
- New Point Series Dropline - Drop lines extend from the X, Y, Z point to the chart wall. Optionally drop lines can extend to the axis min or max value or to a user specified value.
- New Bar Connect Lines - The Bar Series now support connector lines between adjacent bars.
- New Float Bar Connector Lines - The Float Bar Series now supports connector lines between adjacent bars.
- New Heat Map Contour Lines - The Heat Map Series now supports annotated contours. The user can specify the formatting of the contour value (elevation), the distance between labels along the contour, whether the labels orientation must follow the contour slope and whether the label should clip the contour line it annotates.
- Time Span Scale - This type of scale allows you to display time duration (time span). The duration is specified in time spans or ticks.
SQL Server Reporting Servicesで作成するレポートに、卓越したデータ可視化機能を追加。

1999に公式ディストリビューターとして登録
