公式サプライヤー
公式および認定ディストリビューターとして200社以上の開発元から正規ライセンスを直接ご提供いたします。
当社のすべてのブランドをご覧ください。
everviz makes it possible to share your data through attractive, interactive charts and maps. No matter who your are or what you do, journalist, researcher or content creator, everviz makes it simple for you to create stunning data visualizations. Enter data directly, drop a CSV file into the editor, copy and paste from Microsoft Excel, or connect to live data via Google Sheet integration.
Use the intuitive editor to choose chart type, edit text, fonts and colors to make your data stand out and then easily publish the result by embedding your interactive visualizations on your website, blog or intranet, or export them as images.
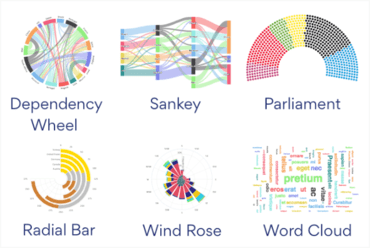
Added more chart types to everviz:

どこでもいつでも誰でも使える便利なデータの可視化サービス
今すぐ everviz ライセンススペシャリストとライブ チャット。