


公式サプライヤー
公式および認定ディストリビューターとして200社以上の開発元から正規ライセンスを直接ご提供いたします。
当社のすべてのブランドをご覧ください。
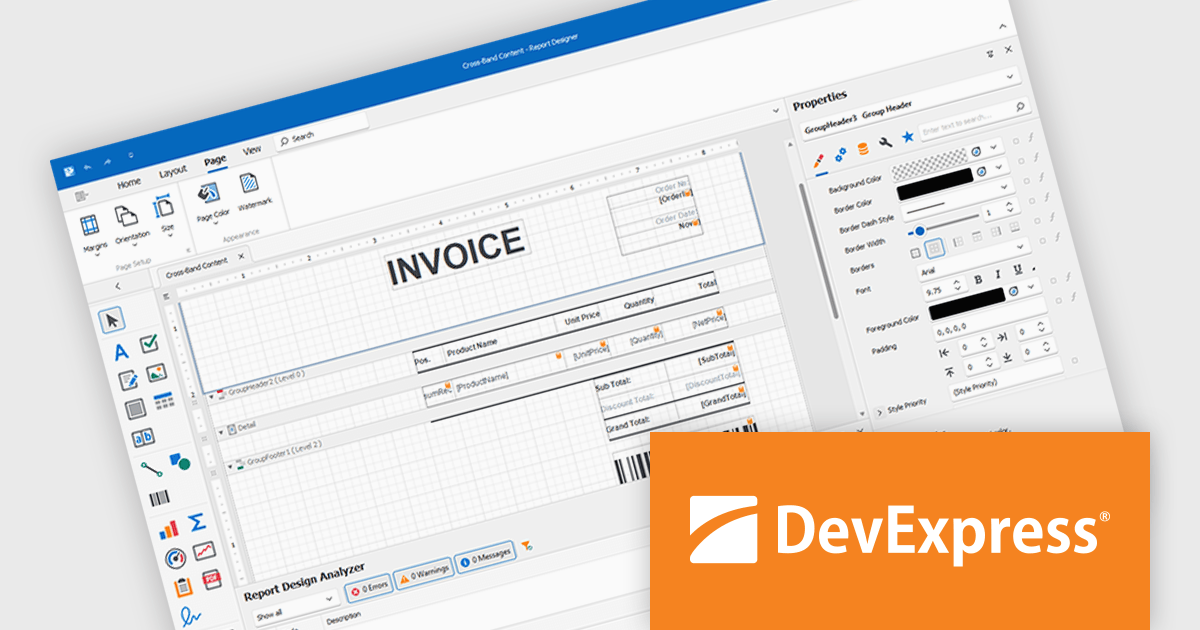
DevExpress Reporting is a comprehensive suite of reporting tools that help developers create visually stunning and highly customizable reports for various applications. With its rich feature set, including data binding, layout design, printing, and exporting capabilities, DevExpress Reporting enables the efficient creation of reports that meet the most demanding business requirements.
DevExpress Reporting lets developers build custom report controls that go beyond the built-in options, making it easier to meet specific project needs. These controls can include unique visual elements or functions that fit naturally into the existing reporting setup, keeping reports consistent in both appearance and behavior. Custom controls also help standardize design, support reusable logic, and handle specialized data presentation that standard controls may not cover, improving maintainability and scalability over time.
DevExpress Reporting is licensed per developer and is available as a Perpetual License with a 12 month support and maintenance subscription. See our DevExpress Reporting licensing page for full details.
DevExpress Reporting is available to buy in the following products:
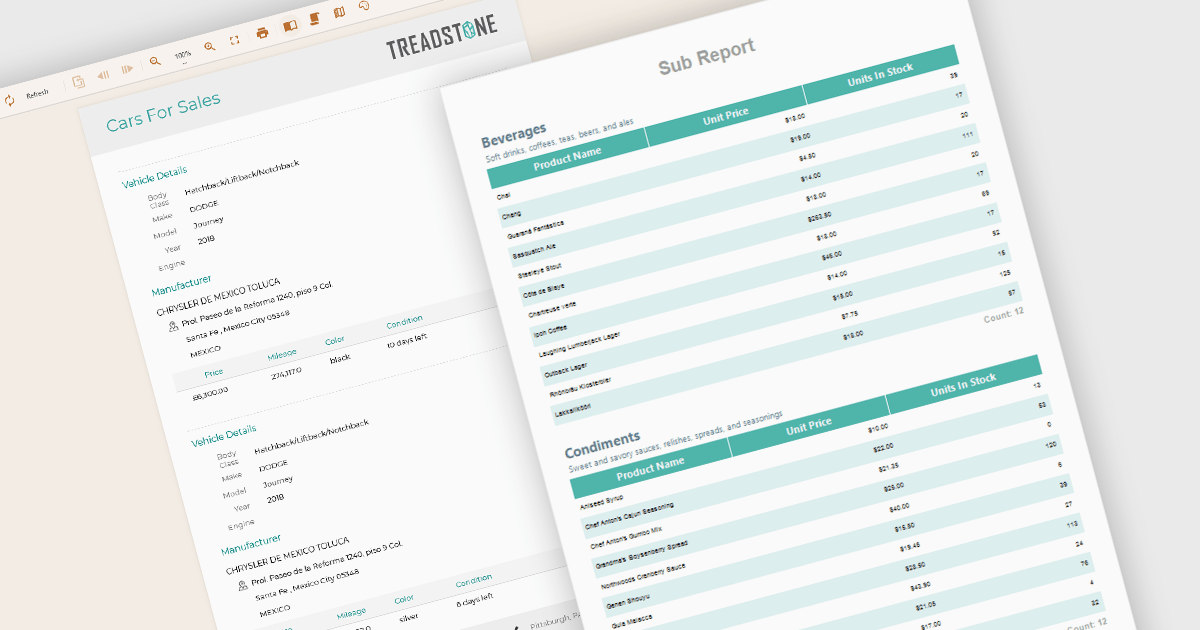
A subreport in a report component is a report embedded within another report, designed to present related or supplementary data that may not fit naturally into the main report’s structure. It is typically used when displaying hierarchical, grouped, or master-detail relationships, such as showing order items within a customer order summary. Subreports can be independently designed and then linked to the main report using parameters or shared data sources. This modular approach improves report organization and reusability, especially when similar data blocks are needed across multiple reports or sections within a complex reporting solution.
Several Angular Reporting controls offer support for subreports including:
For an in-depth analysis of features and price, visit our Angular Reporting controls comparison.
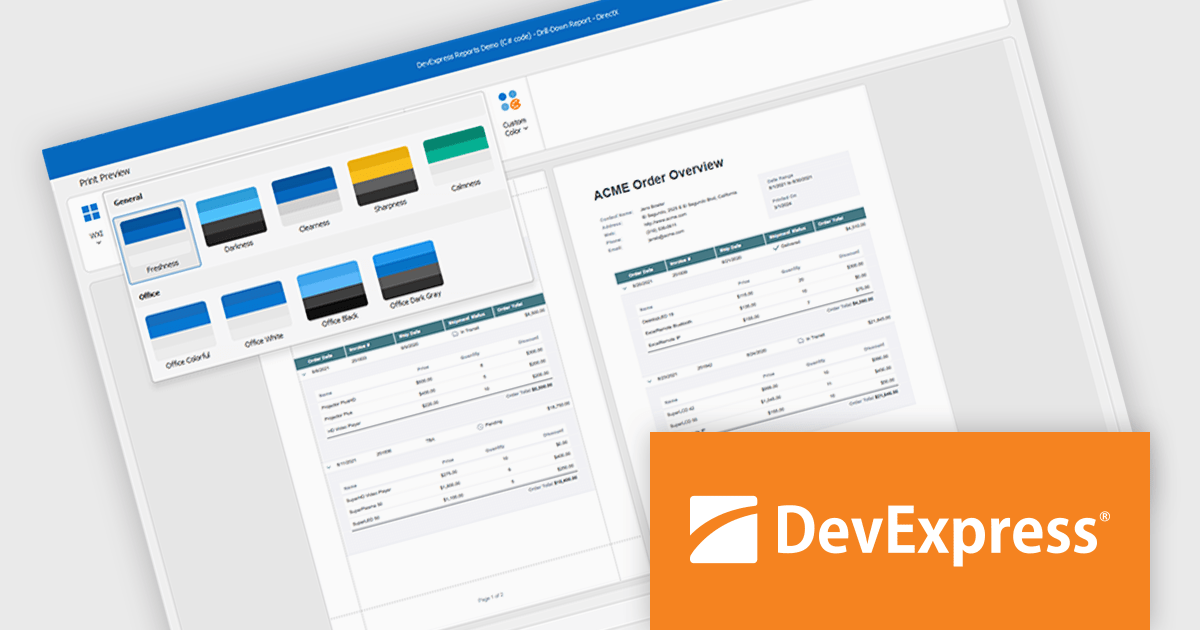
DevExpress DXperience is a comprehensive development suite that enables developers to build high-performance applications for Windows, Web, mobile, and tablet platforms using a unified set of controls and tools. It includes hundreds of desktop UI controls for WinForms, WPF, and reporting, as well as web UI controls for Blazor, ASP.NET, MVC, Core, Bootstrap Web Forms, JavaScript, Angular, React, Vue, and web reporting, plus productivity tools like XPO ORM and CodeRush for Visual Studio. With its extensive component library, DXperience accelerates development, ensures visually consistent and responsive interfaces, and is ideal for creating enterprise applications, data-driven web apps, dashboards, and reporting solutions.
DevExpress DXperience enhances application development with new app-wide themes and skins, allowing developers to apply a consistent, modern visual style across entire projects with minimal configuration. By providing professionally designed themes that align with Microsoft Office and Windows 11 aesthetics, along with built-in tools for customizing these designs, it improves the UI design process and reduces the need for manual styling. This enables developers to focus on functionality while delivering polished, cohesive user interfaces that improve usability and maintain a professional appearance across all application modules.
DevExpress DXperience is licensed per developer and is available as a Perpetual License with a 12 month support and maintenance subscription. See our DevExpress DXperience licensing page for full details.
For more information, visit our DevExpress DXperience product page.
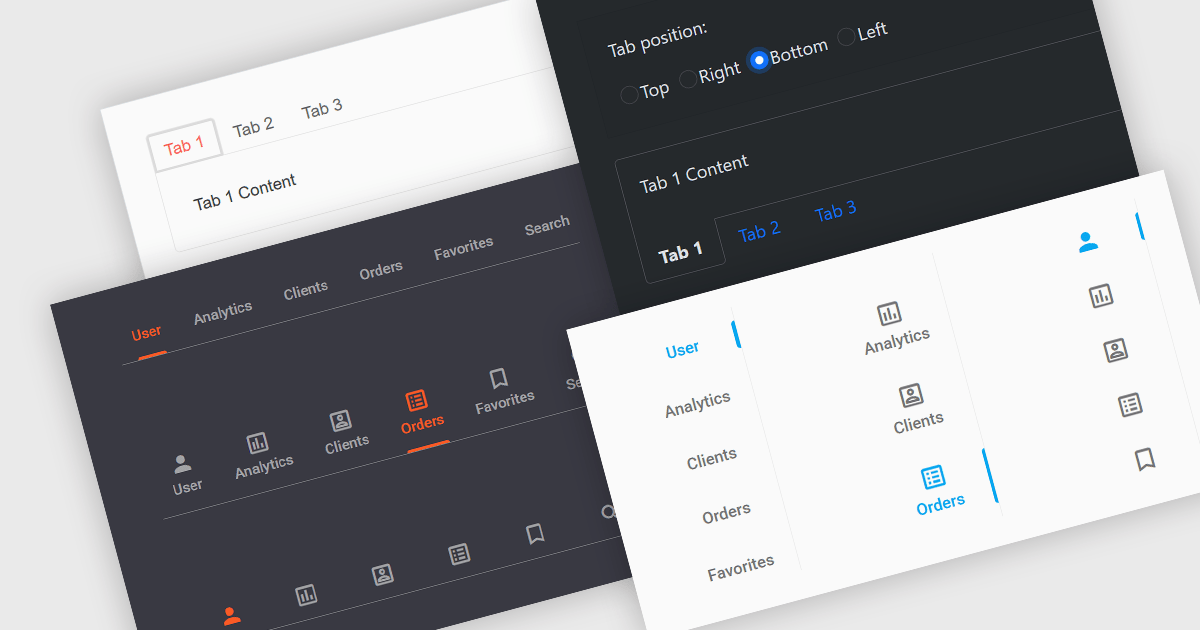
Tabs are a common user interface element that allows users to navigate between multiple sections or views within the same window by clicking on labeled tabs, typically displayed in a row. Each tab presents a different set of information or controls, helping to organize content in a way that reduces clutter and makes it easier to find relevant features without switching between multiple windows or pages. Creating a tabbed UI to switch between sections provides faster access to key areas, and improves usability by maintaining context. This approach is especially useful in applications with layered data or multiple tool sets, where managing space and context is critical.
Several Angular UI suites provide you with tab functionality, including:
For an in-depth analysis of features and price, visit our comparison of Angular UI suites.
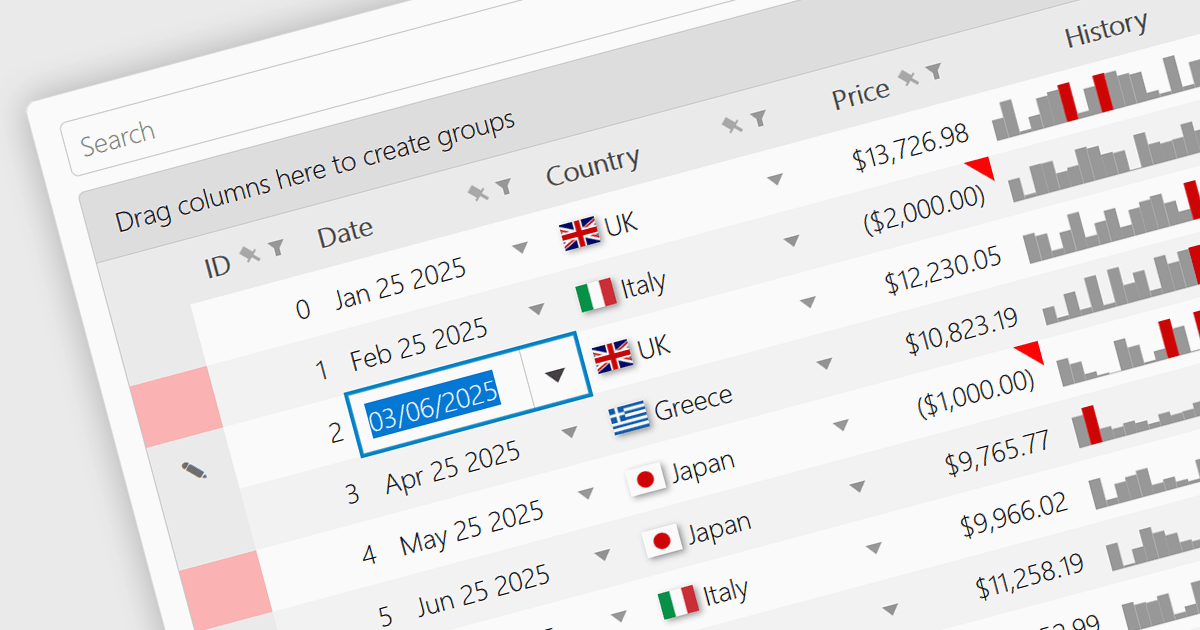
A date/time cell type in a JavaScript Grid control lets developers manage temporal data more effectively by treating input as actual JavaScript Date objects rather than plain text. This enables built-in features like calendar popups, time pickers, and structured output formats such as "09/09/2025" or "Sep 9 2025", making it easier for users to interact with the data accurately. It's especially useful in applications that rely on scheduling, activity logs, or time-driven reports. Most modern grid libraries also support localization, formatting, and input validation to ensure the cell behavior fits seamlessly with the application's design and data standards.
Several JavaScript Grid controls offer support for Date/Time cell types including:
For an in-depth analysis of features and price, visit our comparison of JavaScript Grid controls.
電話: (888) 850 9911
Fax: +1 770 250 6199


