


公式サプライヤー
公式および認定ディストリビューターとして200社以上の開発元から正規ライセンスを直接ご提供いたします。
当社のすべてのブランドをご覧ください。
ONLYOFFICE Docs is a comprehensive online editor, allowing users to create text documents, spreadsheets, presentations, and forms. It enables your users to edit, share, and collaborate on documents online in their preferred browser, within your own application. It is fully compatible with OOXML (Office Open XML) formats and supports popular Microsoft Office and other document formats such as CSV, DOC, DOCX, EPUB, HTML, ODP, ODS, ODT, PDF, PPT, PPTX, RTF, TXT, XLS, and XLSX.
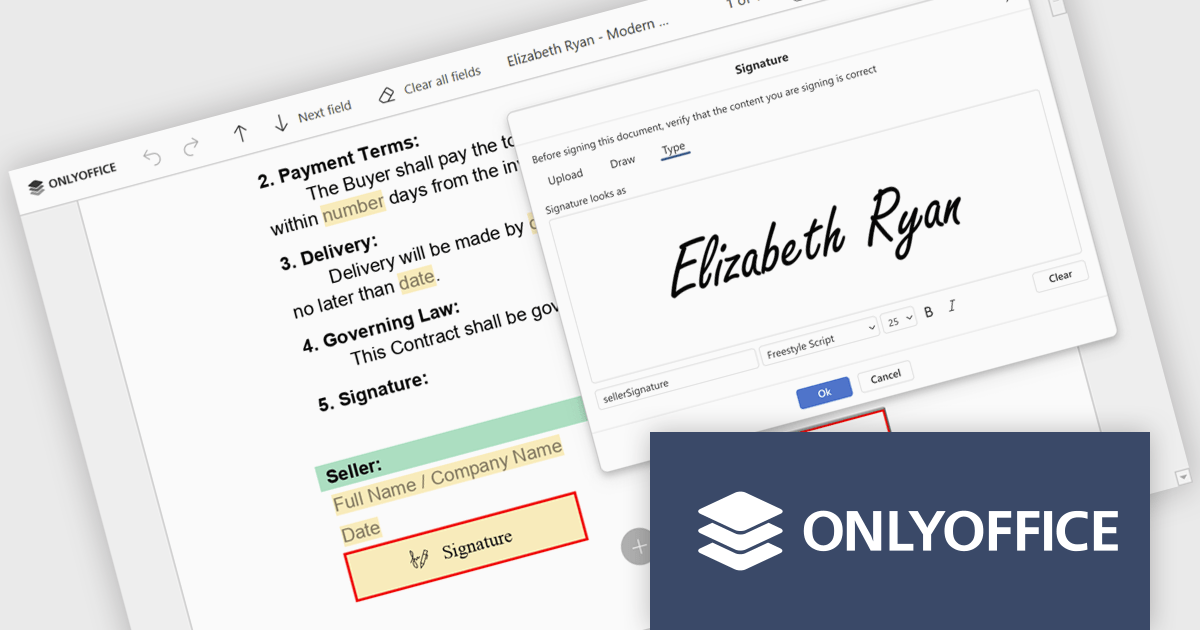
The ONLYOFFICE Docs v9.3 update includes an improved PDF Forms signature field which now allows users to draw their signature directly on screen using a mouse or touch-enabled device. This option provides a more personal and natural signing experience, particularly in scenarios where uploading an image or typing a name is not practical. By supporting freehand input within the form itself, it helps maintain document authenticity while keeping the signing process intuitive and accessible across devices.
To see a full list of what's new in v9.3, see our release notes.
ONLYOFFICE Docs Developer Edition is licensed by the number of simultaneous document connections and is available as an annual license with 1 year support and upgrades. See our ONLYOFFICE Docs Developer Edition licensing page for full details.
For more information, see our ONLYOFFICE Docs Developer Edition product page.

For 15 years, DlhSoft and ComponentSource have partnered to deliver powerful scheduling and project management solutions to developers around the globe. This long-standing collaboration has enabled ComponentSource to extend DlhSoft’s reach into international markets, ensuring customers can easily access robust, high-quality components backed by trusted distribution and service. Together, they have supported development teams building sophisticated business applications across a wide range of industries.
DlhSoft specializes in advanced Gantt chart and scheduling components for Microsoft platforms, providing developers with the tools needed to integrate rich project visualization and planning capabilities into their applications. A key product in this portfolio is DlhSoft Gantt Chart Library for WPF Standard Edition, which helps developers create powerful Gantt charts featuring customizable grid columns, summarized hierarchical data, draggable bars and dependency lines, copy-paste and undo-redo functionality, filtering and hierarchical sorting, and detailed item change events.
This 15-year partnership enhances ComponentSource’s ability to differentiate its product offering by including specialized, enterprise-ready scheduling components within its extensive catalog of developer tools. By delivering DlhSoft products worldwide through its established ecommerce infrastructure, multilingual support, and global marketing reach, ComponentSource ensures customers everywhere can confidently evaluate, purchase, and implement these solutions in their projects.
Learn more about DlhSoft.

DevExpress and ComponentSource have worked together for 25 years, building a long-standing partnership focused on providing professional developer tools. DevExpress is known for its extensive range of UI controls, reporting tools, dashboards, and application frameworks across platforms including .NET, JavaScript, Blazor, WinForms, WPF, and ASP.NET. Together, the two companies support development teams creating desktop, web, and mobile applications.
At the center of this collaboration is DevExpress Universal, a flagship product available through ComponentSource, giving developers access to the full suite of DevExpress UI controls, reporting, and testing tools in a single subscription. This comprehensive offering helps teams standardize on one vendor while covering multiple platforms and project requirements.
This long-term partnership strengthens ComponentSource’s product portfolio by including one of the most widely used developer toolsets in the industry. It also enables ComponentSource to deliver DevExpress products to customers worldwide, supported by international sales teams, local currencies, and licensing expertise that simplify the purchasing process for organizations across different regions.
Learn more about DevExpress.
LightningChart JS is a high-performance JavaScript charting library that utilizes WebGL rendering and GPU acceleration to deliver exceptional performance for a wide range of data visualization needs. It is designed to handle large datasets and complex visualizations with ease, enabling developers to create interactive and visually appealing 2D and 3D charts. Ideal for applications demanding smooth real-time data updates, such as financial platforms, engineering tools, scientific research dashboards, and industrial monitoring systems, LightningChart JS provides a comprehensive API for customization and integration into web-based projects.
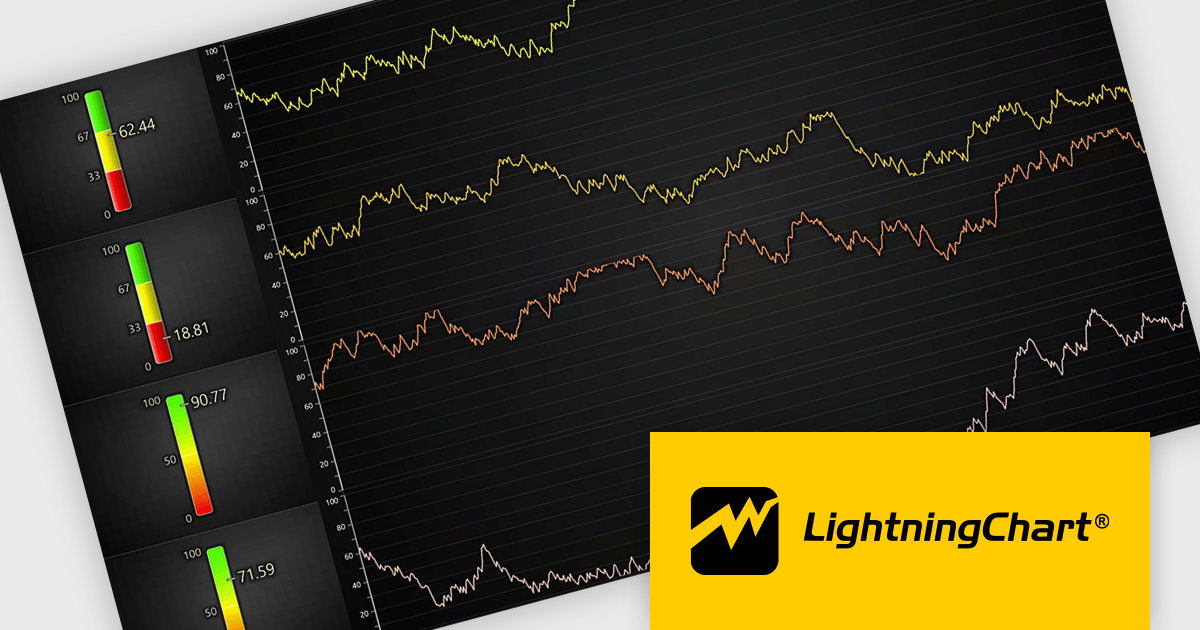
The LightningChart JS v8.2 update introduces a new Linear Gauge Chart that enables software developers to present real-time metrics in a clear, structured format within modern web applications. It supports continuous live data updates, configurable interpolated or discrete color steps for representing thresholds and ranges, and both vertical and horizontal orientations to accommodate different layout requirements. The chart also allows current values to be displayed directly on the gauge and supports custom icons, giving developers greater control over visual consistency while building intuitive, status-focused dashboards for monitoring and analytics use cases.
To see a full list of what's new in v8.2, see our release notes.
LightningChart JS is licensed per developer and is available as an annual license with 1 year support. See our LightningChart JS licensing page for full details.
For more information, see our LightningChart JS product page.

ComponentSource and SurveyJS have spent the past year working together to bring form building and survey automation tools to developers and organisations worldwide. SurveyJS is known for its flexible, client side JavaScript components that make it easy to create, customise, and manage forms and surveys across modern web applications, with support for frameworks such as Angular, React, and Vue. Built around a JSON based architecture, SurveyJS enables teams to integrate advanced form functionality into existing systems without backend restrictions or long term maintenance overhead.
At the heart of the SurveyJS product lineup is SurveyJS Creator, the flagship visual form builder available through ComponentSource. This highly configurable tool allows users to design complex forms and surveys through an intuitive interface, while retaining full control over appearance, behaviour, and data structure to meet precise project requirements.
Through this partnership, ComponentSource strengthens its portfolio of developer focused tools by offering a proven, highly customisable form solution that complements its wider range of UI and application development products. By working closely with SurveyJS, ComponentSource helps deliver these solutions to a global audience, providing licensing, support, and reach that enable the SurveyJS brand to scale internationally while giving customers access to trusted, best in class technology.
Learn more about SurveyJS.
電話: (888) 850 9911
Fax: +1 770 250 6199


